 ultrarelevant.com
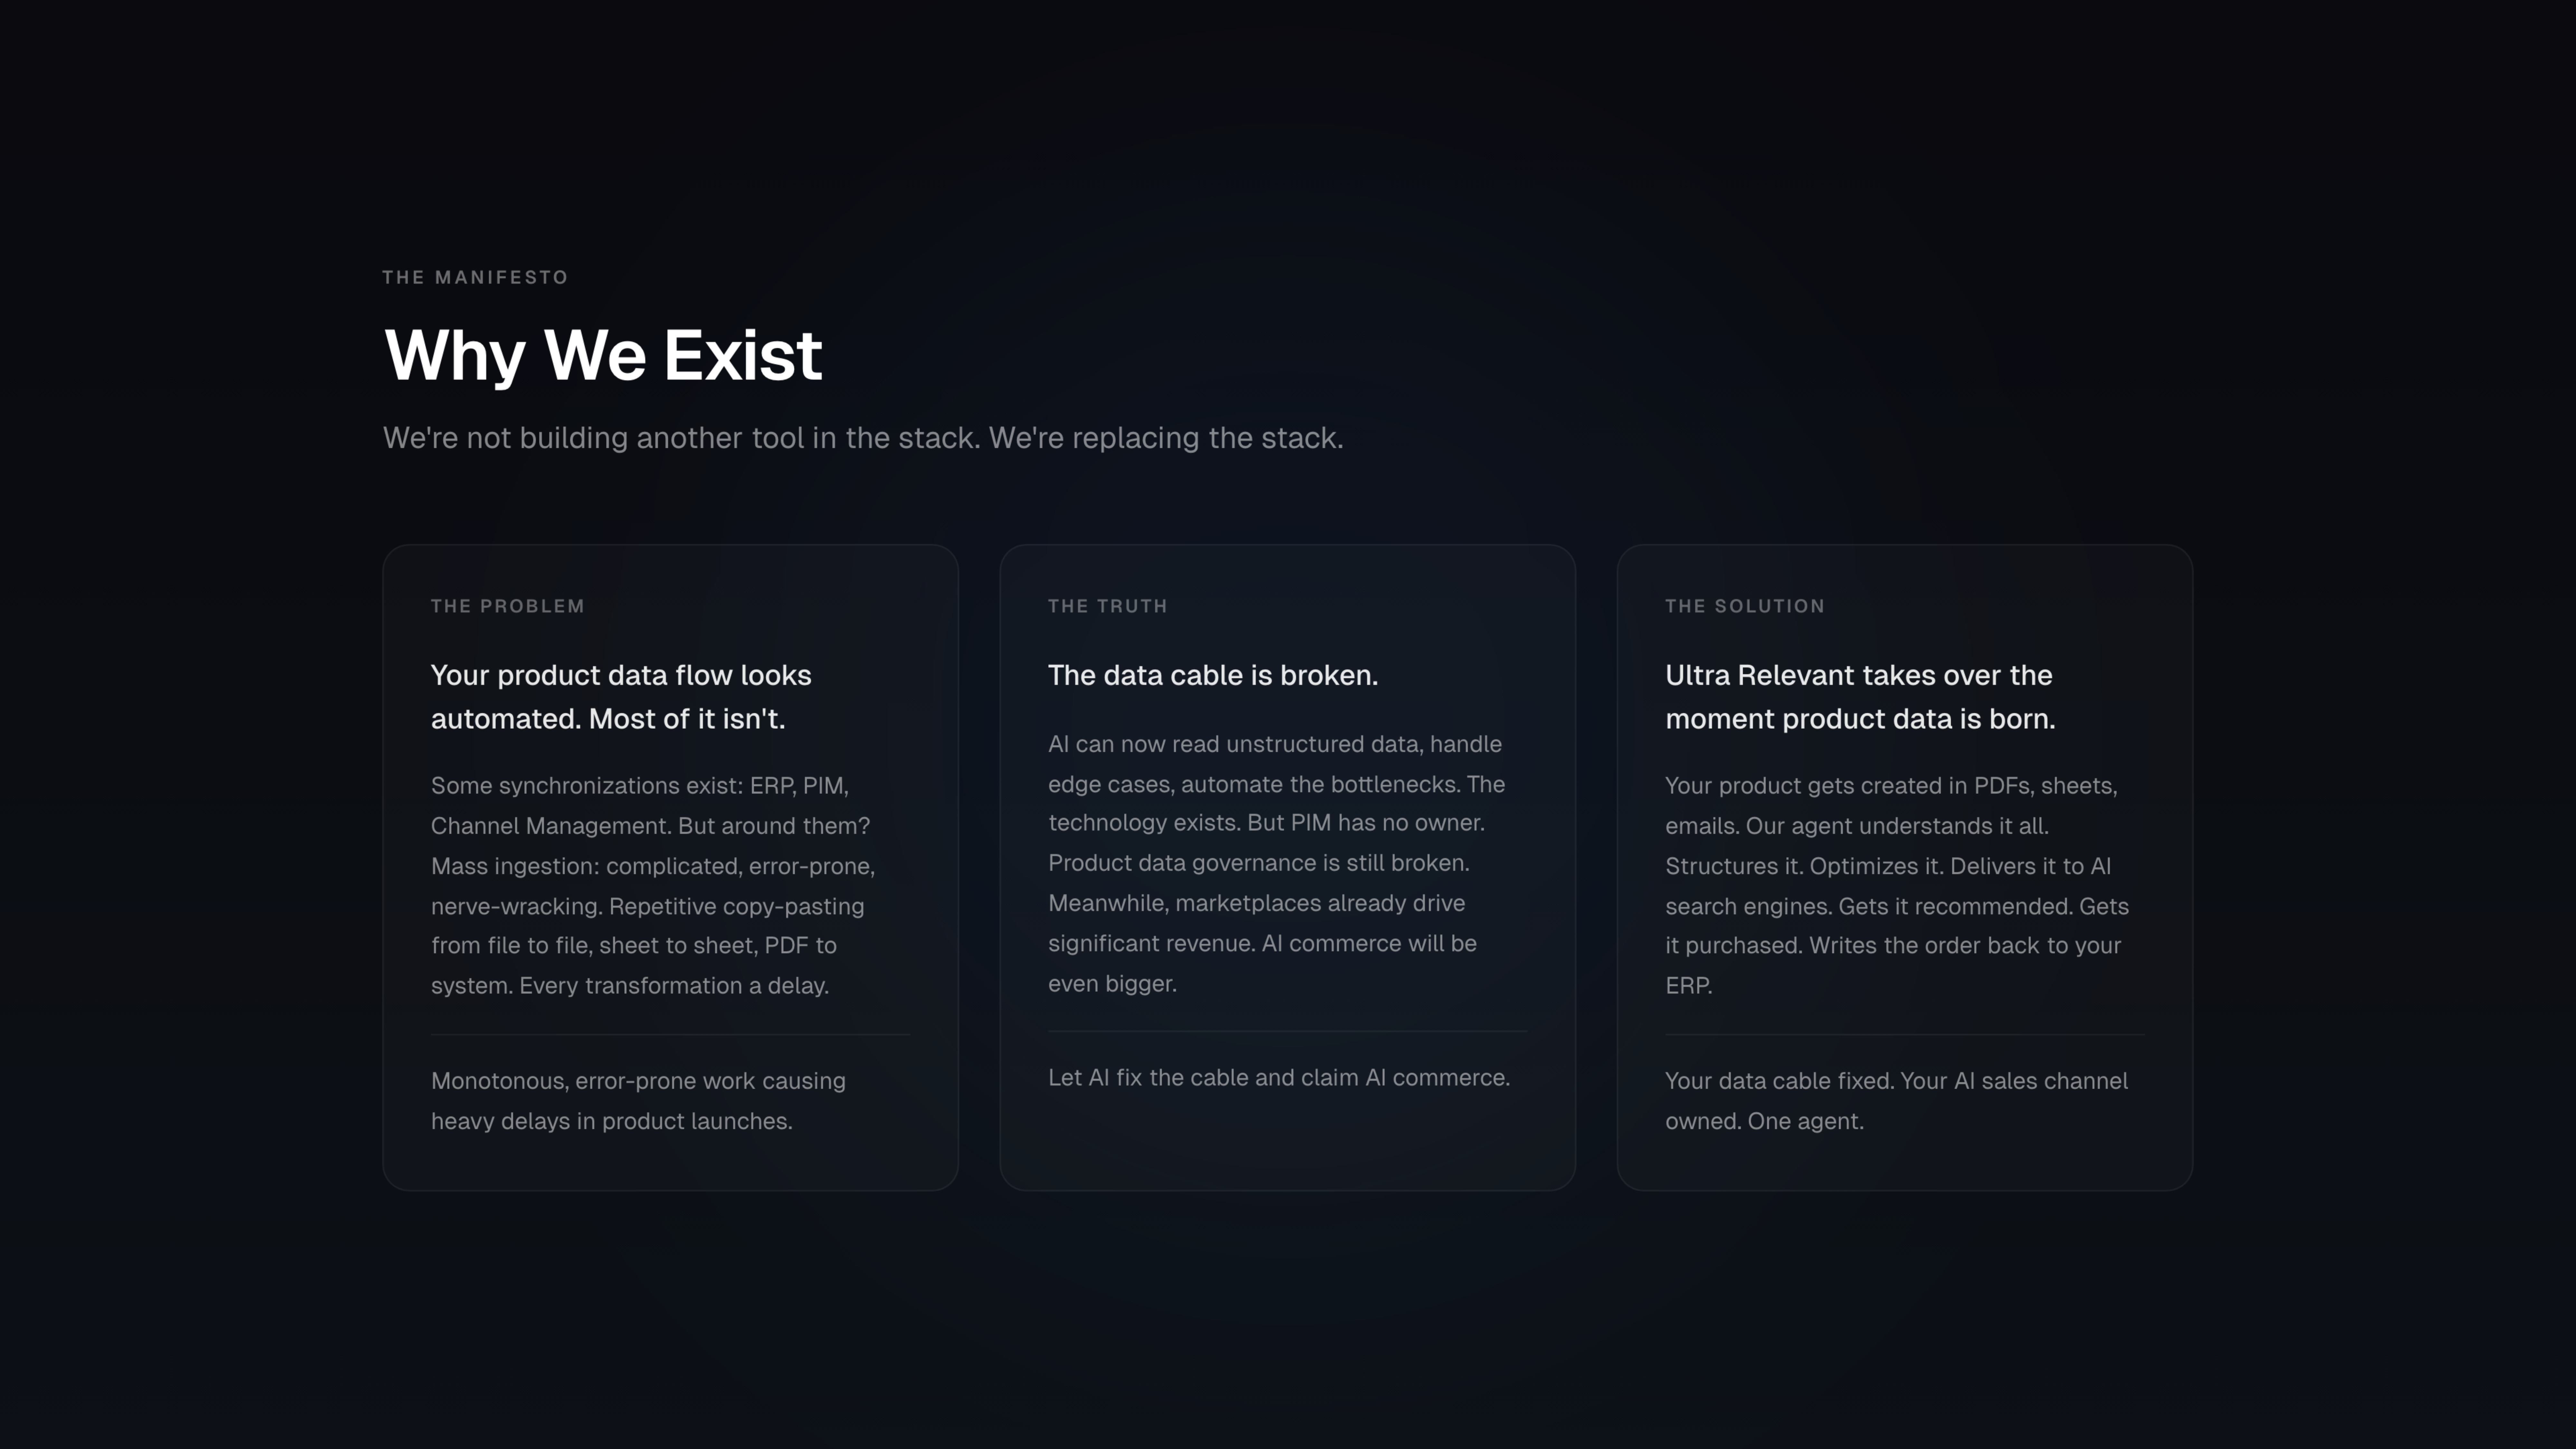
The Product Data Cable is Broken
We spent weeks inside the product data workflows of mid-market manufacturers, watching product managers copy-paste from PDFs, marketing teams wait weeks for launches, and entire catalogs go invisible to AI shopping assistants because nobody could fill 150 attributes fast enough.
This document captures what we found: a systemic breakdown between where product data lives and where commerce is moving. The infrastructure built for human browsers cannot feed the AI agents now controlling the wallet. We believe this gap is a generational opportunity.
Executive Summary
The Market Shift
I. The Fundamental Shift: The Death of the Funnel & The “Shortlist” Era
We are witnessing the most aggressive compression of the buying journey since the invention of the search engine. The traditional “E-Commerce Funnel” is collapsing.
The Old Mechanism (Browsing): The current workflow is inefficient. A user searches (Google), browses (opens 10 tabs), compares (manually filters criteria like price/specs), and selects.
The New Mechanism (Retrieving): AI Agents compress these steps into milliseconds. A user prompts ChatGPT or Gemini: “Find me the best ergonomic chair under €500 with a mesh back that ships to Berlin by Tuesday.”
The Shift: The AI does not browse; it retrieves. It generates an immediate Shortlist based on semantic matching. The user does not click links to explore; they execute a transaction based on the agent’s recommendation.
The Consequence: The “Job to be Done” gets shorter. If a product’s data is not understandable by the agent’s logic (vector embeddings), the product effectively ceases to exist. It is not just ranked lower; it is invisible to the machine controlling the wallet.
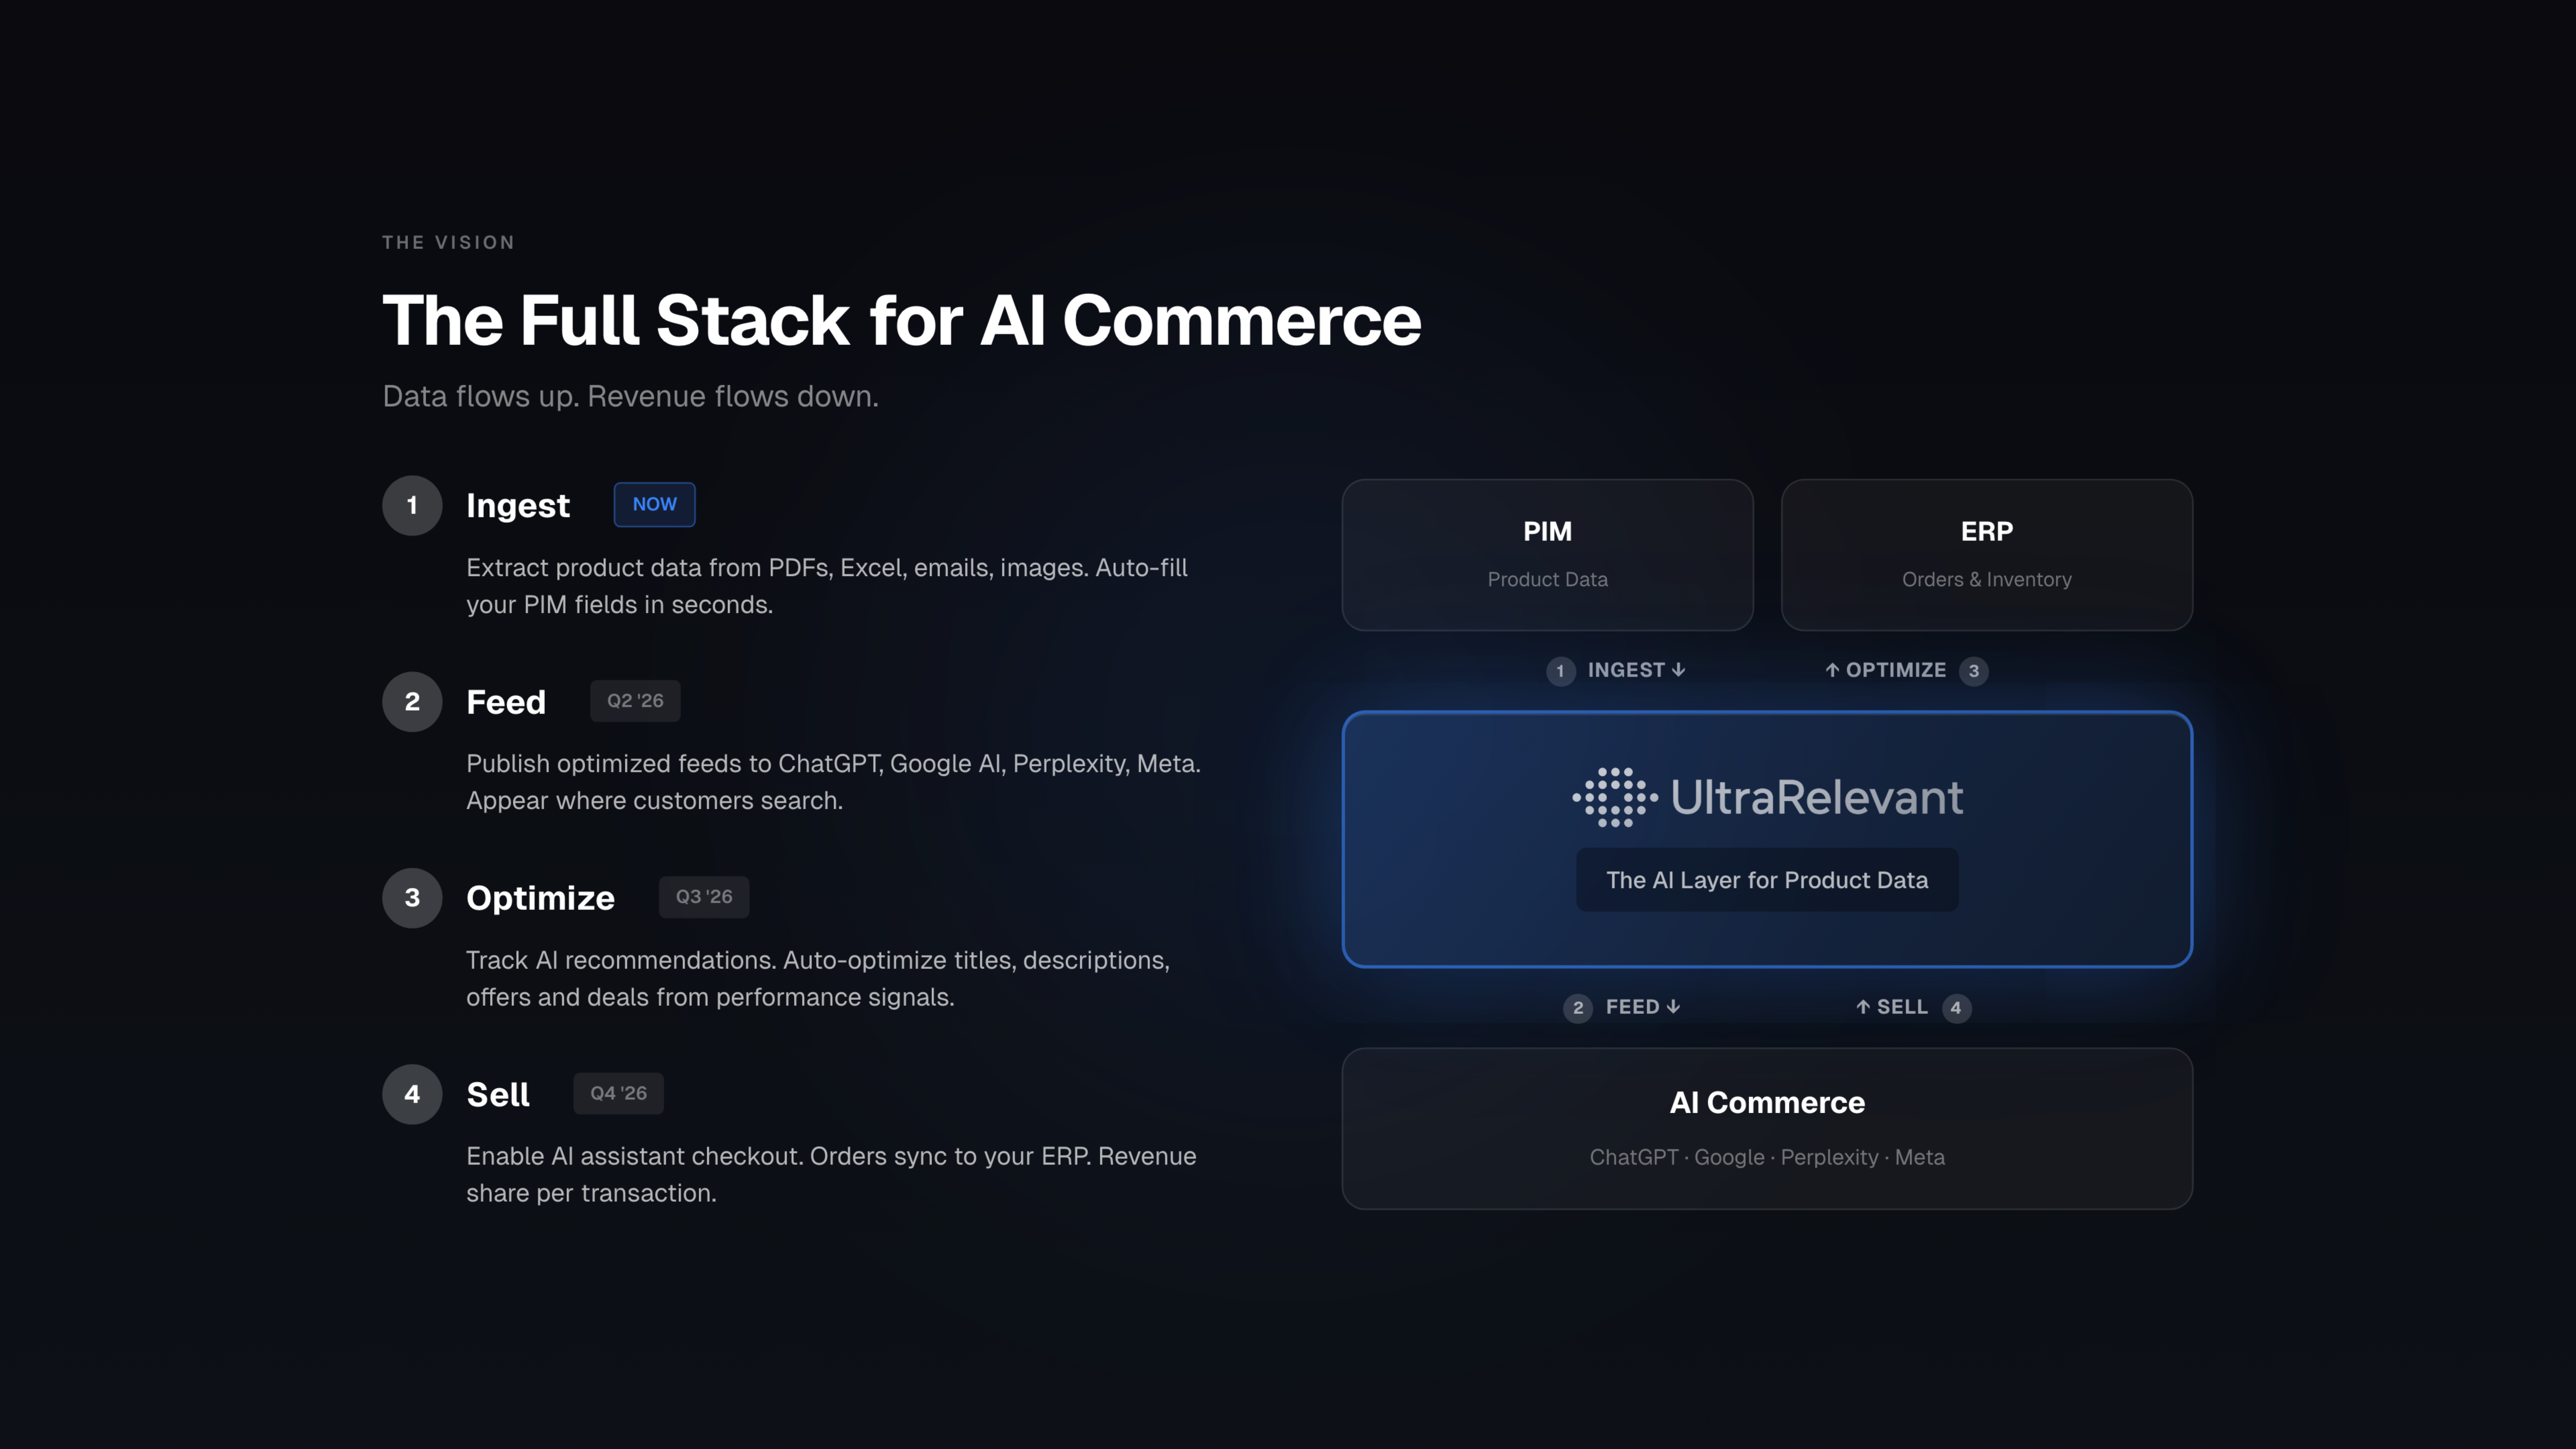
II. The Infrastructure Crisis: The “Product Data Cable” Collapse
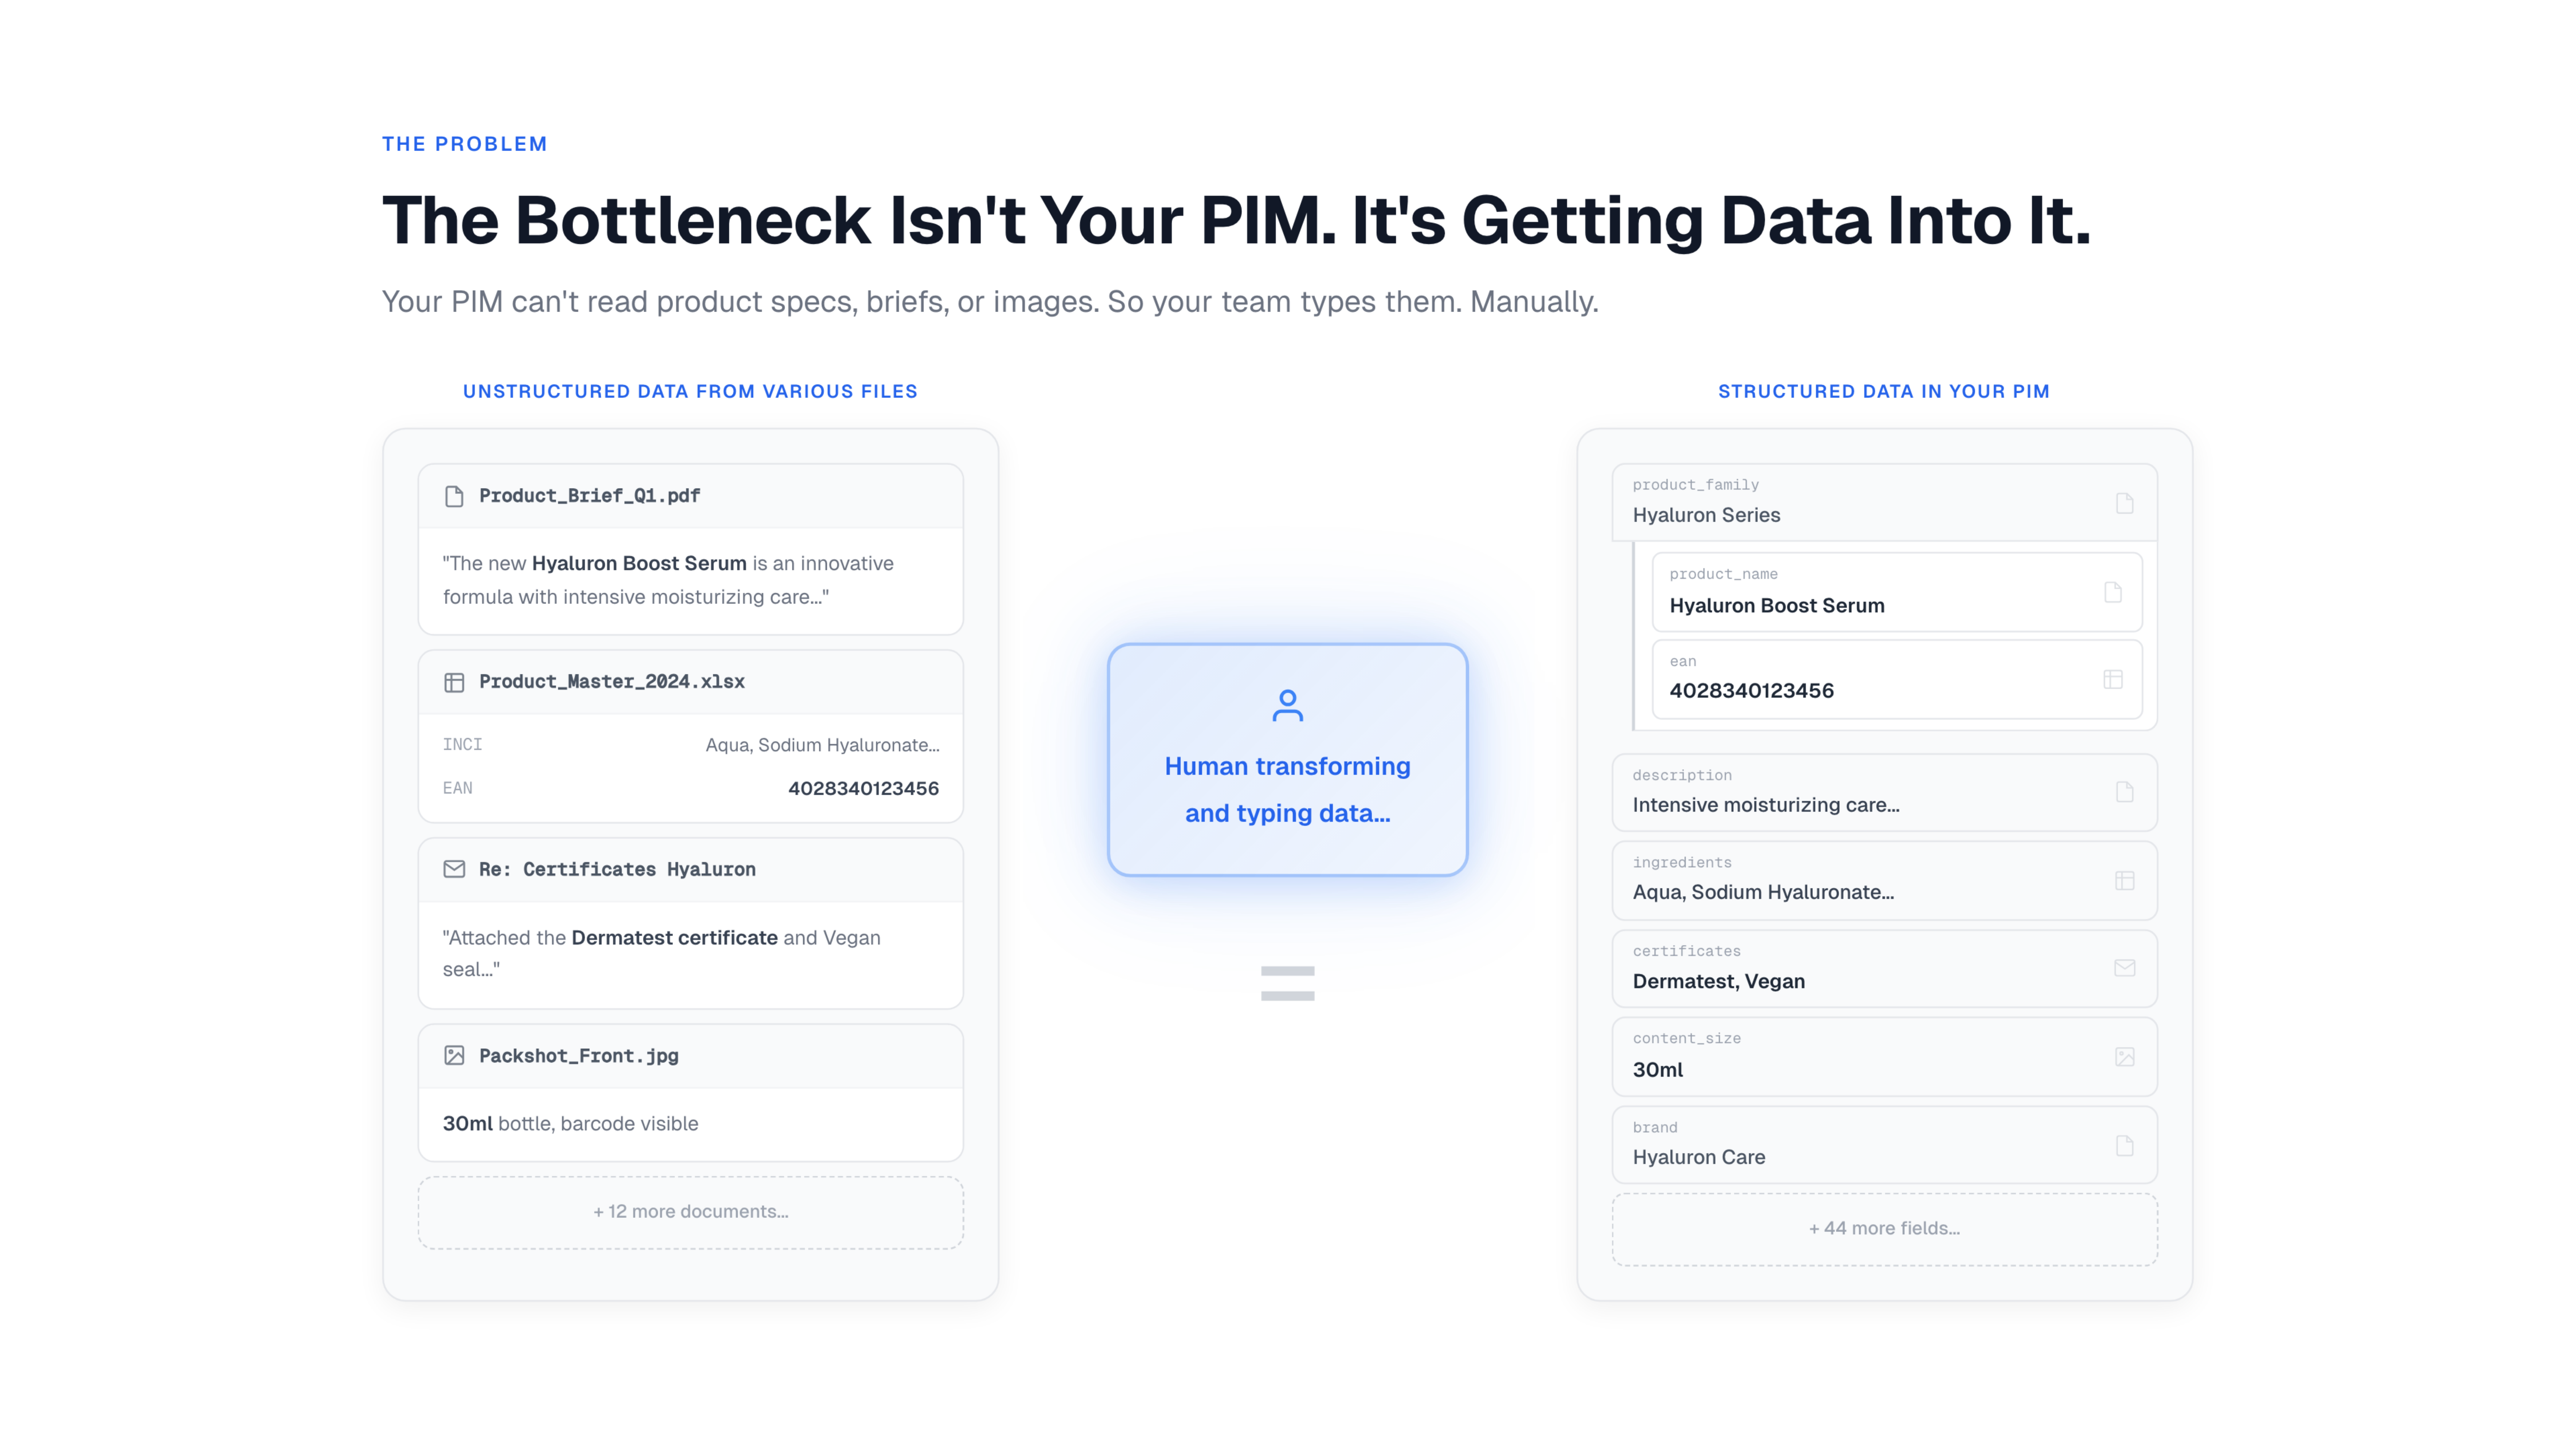
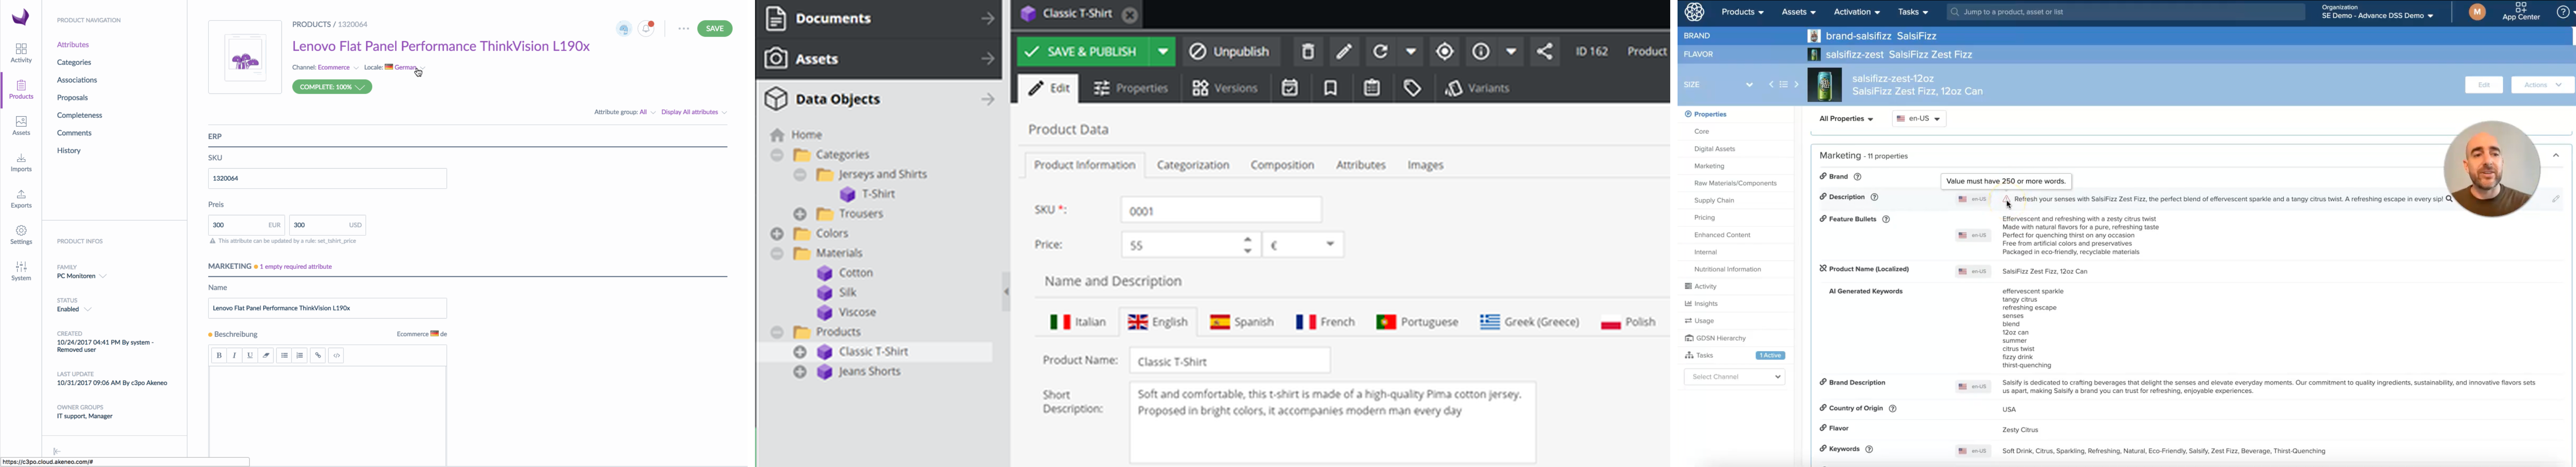
While the interface of commerce is changing, the backend infrastructure is fundamentally broken. The current flow of data—the “Product Data Cable”—was designed for human readability, not machine inference.
The Fractured Flow: Data moves from ERP (Source of Truth) → PIM (Enrichment) → Channel Management → Marketplaces.
The Semantic Gap: This infrastructure relies on keywords and static attributes. It fails to capture Problem-Solution Mapping.
Example: A “High Load Bearing” in an ERP is just a SKU. To an AI Agent, it needs to be mapped as a “Solution for high-friction gravel pit excavation.” Current PIMs cannot store or transmit this contextual nuance.
The Complexity Reality: Companies are not monoliths; they are collections of distinct data flows with different weights.
Cosmetics Example: A sunscreen requires regulatory compliance data (heavy text), while a lipstick requires visual hex codes (image data). The current “Cable” tries to force these distinct strands into a single, rigid pipe, causing massive data degradation before it even reaches the AI.
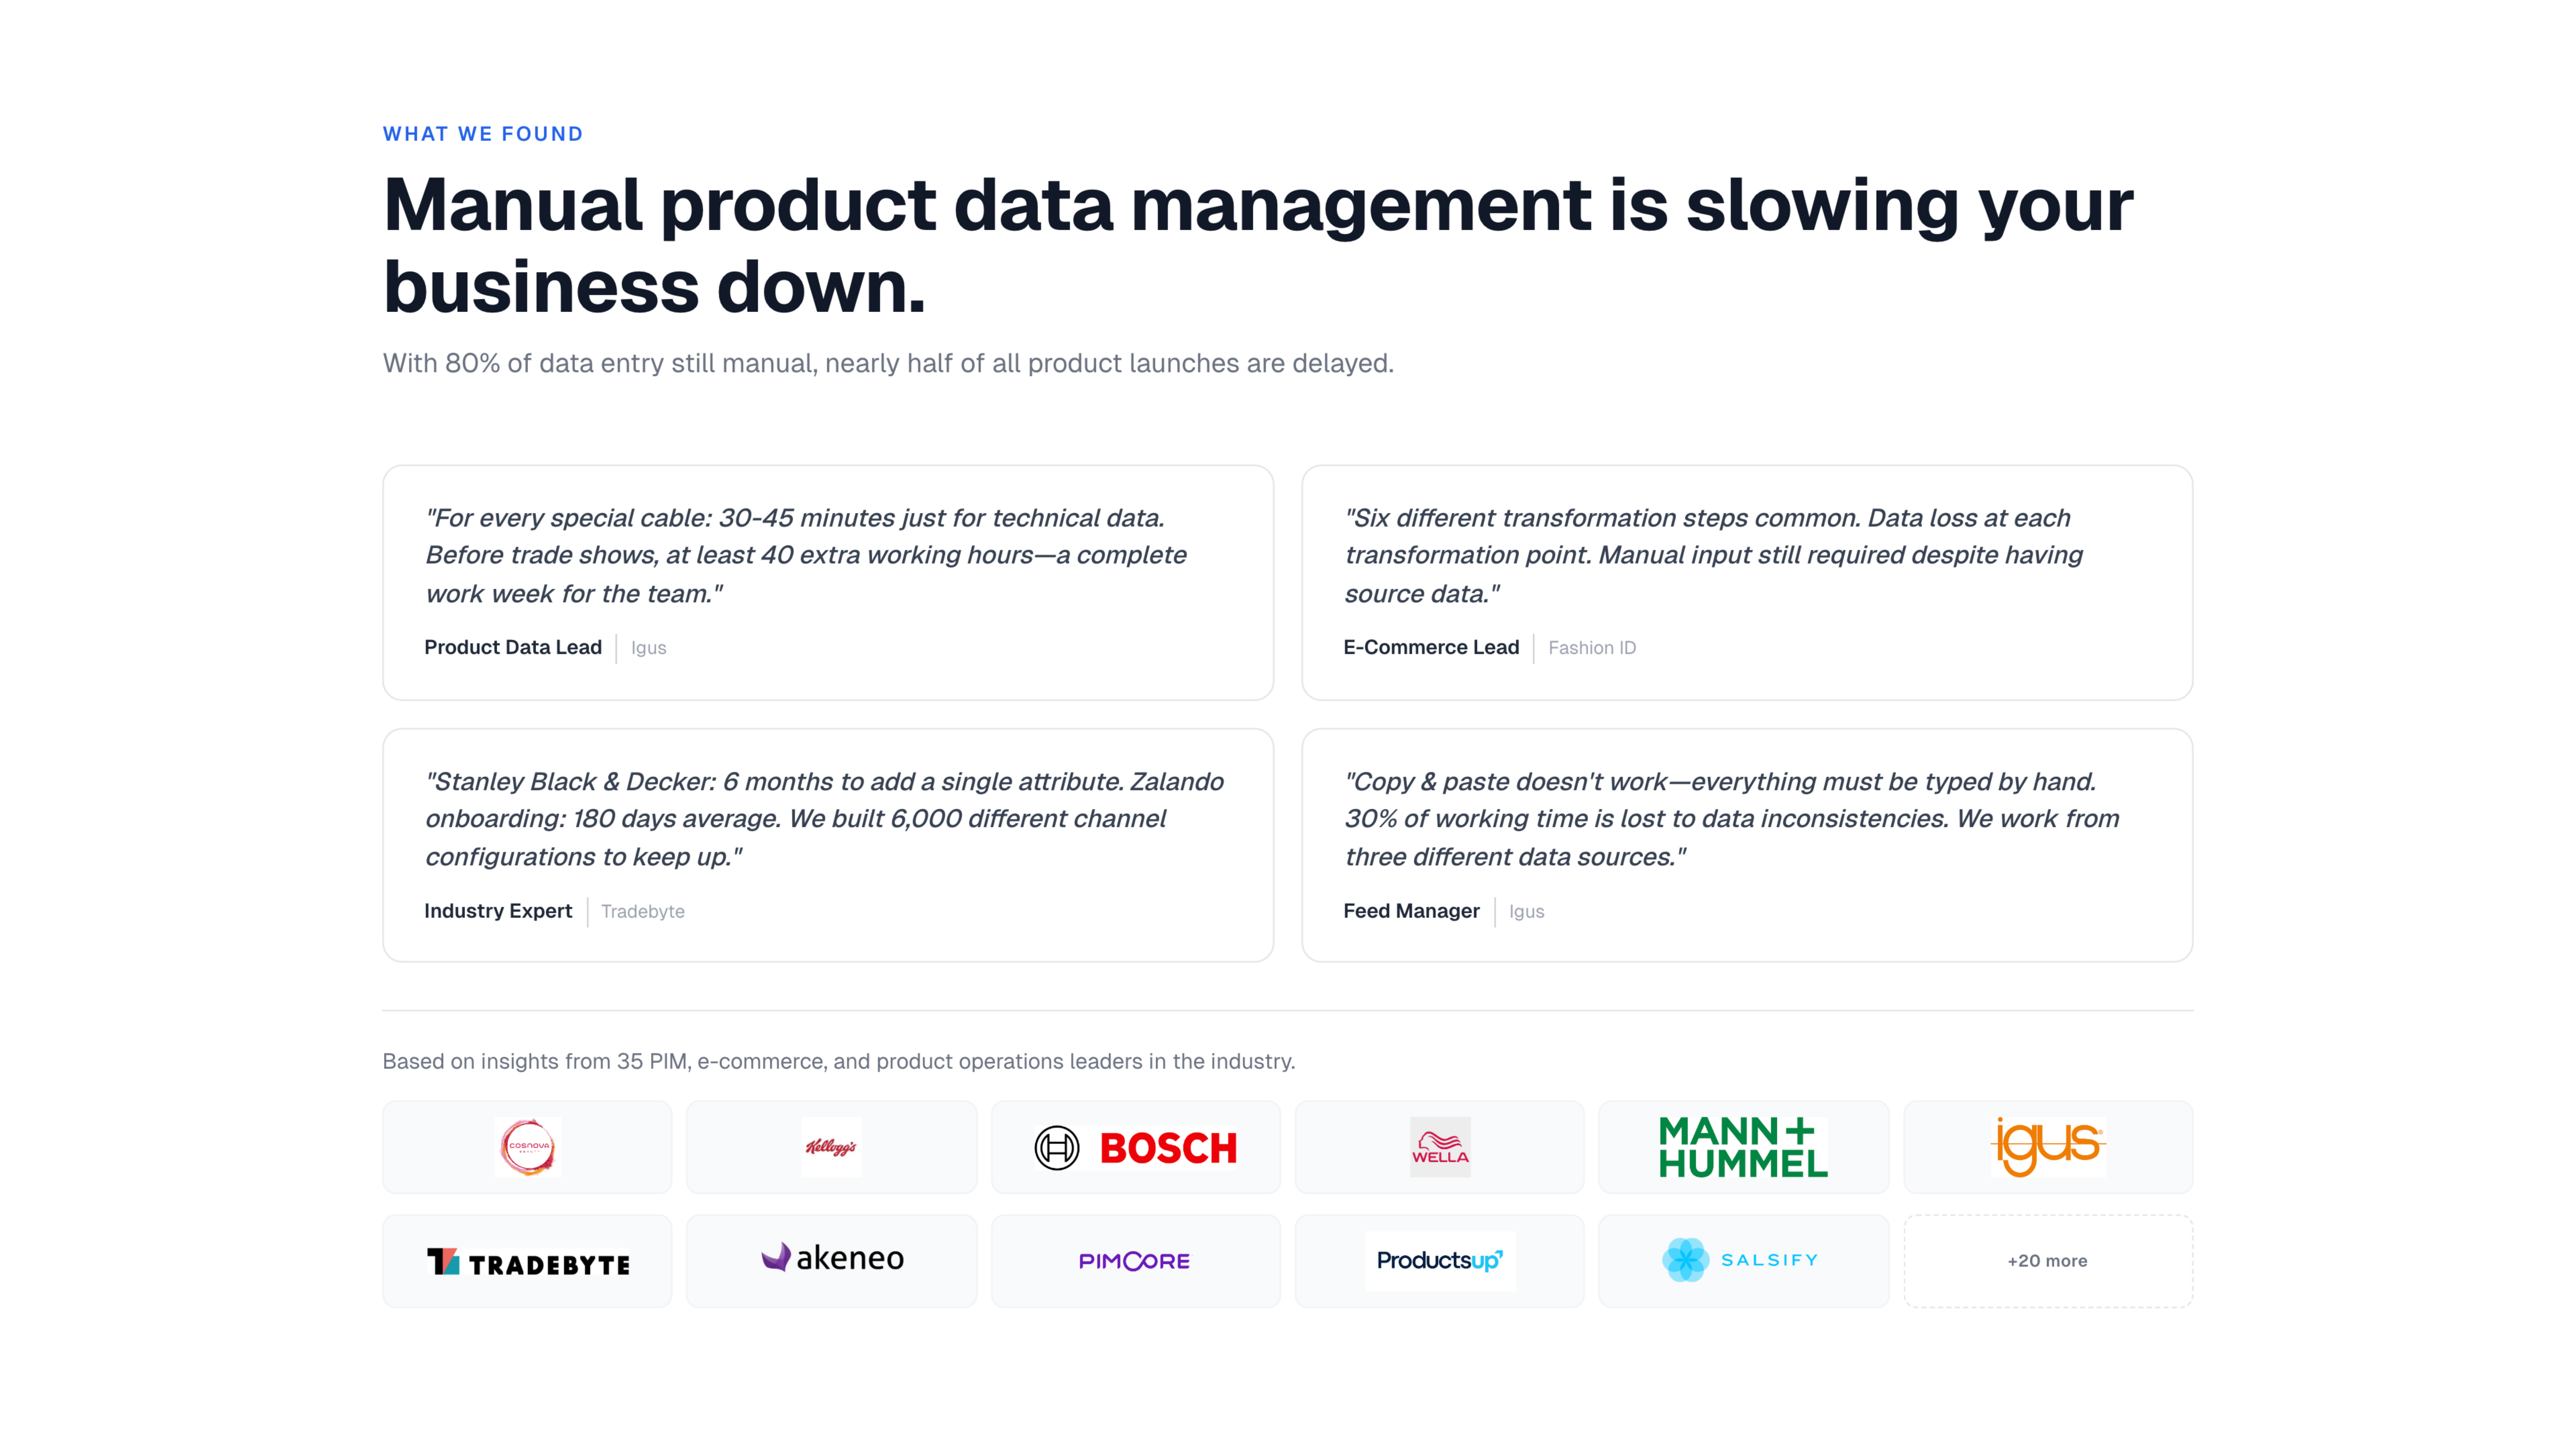
The Manual Bottleneck: Despite digital tools, the industry relies on a “70% Manual Bottleneck.” The actual filling of the cable is a nightmare of Excel sheets and manual copy-pasting. This introduces “silent errors” (typos, missing context) that cause AI models to hallucinate or reject the product entirely.
III. The New Economic Architecture: “The Brain” and “The Body”
The market is bifurcating into two distinct roles, changing how value is captured.
The Interface (The Brain): Google (Gemini) and OpenAI (ChatGPT) will dominate the customer relationship.
Prediction: They will not become retailers or logistics providers.
Monetization: They will monetize via embedded affiliation. They will act as the ultimate sales clerk, taking a cut of the transaction for being the “Agent” that closed the sale.
The New “Ads”: Paid advertising will shift from “Blue Links” to Ranking Improvements inside the chat response.
The Fulfillment (The Body): Brands and logistics providers will handle the physical movement. However, to get the “Brain” to choose them, they must feed it perfect, semantically rich data.
IV. The Velocity Mismatch: Why Incumbents Will Fail
There is a structural reason why existing PIM vendors and Channel Management services cannot solve this.
Legacy Pace: Enterprise software operates on 18-month roadmap cycles.
AI Pace: The AI landscape changes weekly (context windows, embedding models, retrieval logic).
The Crash: PIMs are building “faster horses” (better interface for humans) while the market demands “engines” (automated data feeding for agents). The incumbents simply cannot move fast enough to adapt to the infrastructure requirements of Gemini or OpenAI.
V. The Rise of GEO & Capital Validation
A new industry is forming to replace SEO, and the smartest capital in the world is betting on it.
SEO is Dead: Optimizing keywords for a blue link is becoming irrelevant.
GEO is Born: Optimizing data structures (Knowledge Graphs) so an AI validates a product as the correct answer to a complex query.
The “Funding Insanity”: The venture capital market has validated this shift with aggressive bets on the application layer.
The Global Signal: It is not just a local phenomenon. In Berlin, Peec.ai (Peak AI) raised a $21M Series A just two years after inception.
The Smart Money: In NYC, Profound AI just raised $35 Million backed by Sequoia.
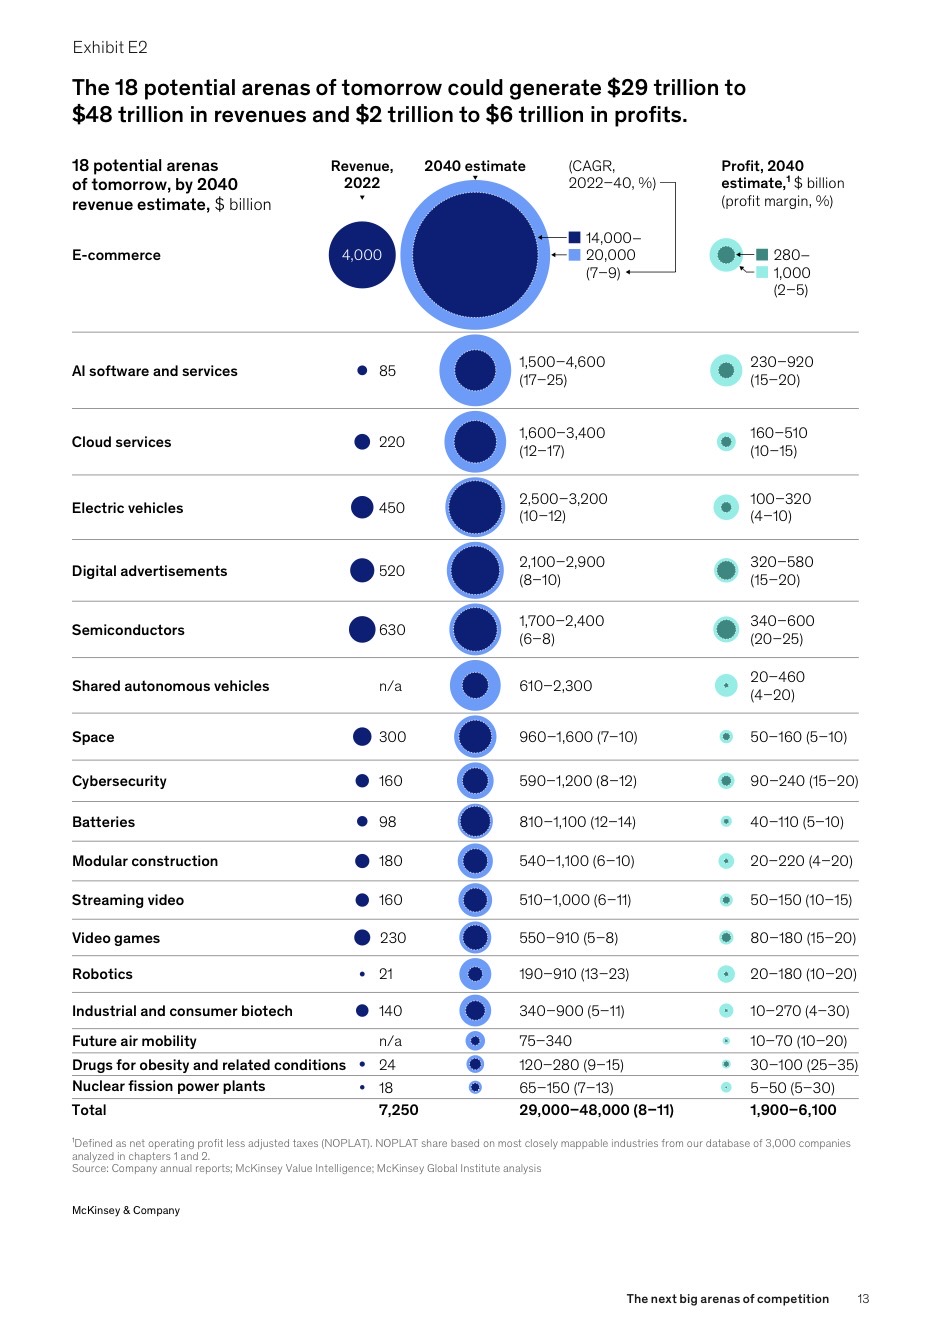
The Implication: When Sequoia and top-tier VCs pour $50M+ into GEO tools within months, the market is screaming that this is the next trillion-dollar frontier. The “Shortlist” era is not a theory; it is being capitalized right now.
The Market Split:
Agencies: See this as a survival mechanism and are aggressively adopting GEO tools to sell to clients.
Enterprises: Currently view this as “Play Money,” failing to realize their entire distribution model is about to be gated by AI agents.
The Problem
In the modern manufacturing landscape, the journey of a product from conception to the consumer’s screen is not a simple line; it is a complex, multi-strand “Product Data Cable.” While the infrastructure of this cable is built on enterprise software, the reality of its operation is a fractured mosaic of manual interventions, domain-specific bottlenecks, and systemic inefficiencies. To understand why a product takes months to reach a marketplace or why AI search engines fail to surface the right results, we must dissect the internal mechanics of this data flow.
I. The Infrastructure: The Core Systems
The “Cable” represents the overarching technical infrastructure. It provides the path, but not necessarily the speed or accuracy. It consists of four primary stages:
ERP (Enterprise Resource Planning): The foundational layer where the “ID” of the product is born (SKU, basic logistics, and raw cost).
PIM (Product Information Management): The enrichment zone where technical specifications are wedded to marketing narratives.
Channel Management: The distribution hub where data is formatted for specific endpoints.
Marketplaces & AI Commerce: The final consumers. Here, AI search engines and marketplaces (Amazon, Zalando, etc.) act as the ultimate judges of data quality.
II. The Strands: Category-Specific Data Flows
A company is not a monolith; it is a collection of Business Units. In a Cosmetics company, for example, the data cable carries three distinct flows:
Flow A: Skincare (Sunscreens/Moisturizers): High complexity in “active ingredient” attributes and regulatory compliance.
Flow B: Color Cosmetics (Lipsticks/Palettes): High complexity in visual attributes, hex codes, and “finish” types (matte vs. gloss).
Flow C: Fragrances: High complexity in “scent notes” (top, heart, base) and emotional storytelling.
Because these categories have fundamentally different attributes, the “Cable” must handle different data weights and speeds simultaneously. A lipstick requires a color swatch (image/hex); a sunscreen requires a legal SPF disclaimer. One size never fits all.
III. The Human Architecture: Departments and Ownership
The data flow is governed by four distinct departments, each adding a layer of complexity to the cable:
Development: The originators. They deal with raw supplier data, chemical compositions, and technical feasibility.
Product Management: The architects. They define the product family and the “logic” of the attributes.
Marketing: The storytellers. They transform technical specs into consumer benefits, dealing with rich text and emotional resonance.
Sales: The executors. They focus on channel-specific requirements, pricing, and “buy-box” readiness.
IV. The Friction: The 70% Manual Bottleneck
While the “Cable” looks digital on an architectural map, the actual filling of that cable is a manual nightmare. We can break down the data ingestion into four distinct, problematic segments:
1. The 30% Systemic Synchronization
Only 30% of the data moves automatically from the previous system or external tools (like Pricing Tools or PLM). This is “clean” data—SKUs, basic dimensions, and weight. However, as we move further from the source (ERP) toward the consumer (AI Commerce), the ability to sync decreases. The more “creative” the data becomes, the less it can be automated by traditional syncs.
2. The 40% Mass Ingestion
The largest chunk of data entry (40%) happens via mass ingestion through sheets. This is categorized as “Complicated, Error-Prone, and Time-Consuming.”
The Problem: Huge Excel files are exported, modified, and re-imported.
The Effect: One wrong cell shift in a sheet of 5,000 lipsticks can lead to a mass-recall of digital data. This process is the primary cause of product launch delays.
3. The 15% Domain-Specific Filling & Transformation
This 15% is “Highly Manual and Highly Repetitive.” It requires a human with domain expertise (e.g., a Chemist or a Product Manager) to look at a technical specification and “translate” it into a system-readable attribute.
The Problem: This involves interpreting PDFs or engineering documents. It cannot be automated because it requires understanding context.
The Effect: This creates a massive internal slowdown because the “Expert” becomes a data-entry clerk rather than a creator.
4. The 15% Manual Copy-and-Paste
The final 15% is the most primitive: manual copy-and-paste from emails, miscellaneous files, or legacy PDF documents.
The Problem: Human fingers moving data from a Word doc to a PIM field.
The Effect: This is where “silent errors” creep in—typos in ingredients or mislabeled shades—that AI commerce engines later penalize.
V. The Data Anatomy: Attributes and Complexity
Inside these flows, the data itself varies in “shape,” creating further drag on the cable:
Attribute Types: We deal with Booleans (Yes/No), Lists (Dropdowns), and Free Text (Descriptions).
Complexity & Depth: A single skincare product might have 150 attributes. Some are short (Boolean: Vegan? Yes), while others are long and sensitive (List of Ingredients/Allergens). The “length” and “sensitivity” of these attributes mean that a mistake in a “Free Text” field (like a health claim) carries significantly more legal risk than a mistake in a “Weight” field.
VI. The Pre-ERP Genesis: Supplier and Development Data
We must acknowledge that the cable starts before the ERP. The initial “raw data” is often fed by Suppliers. This data is usually unformatted and chaotic. When the Development department creates a new product, they are working in a vacuum, often using their own tools or offline files. By the time this reaches the ERP, it has already been filtered through manual sheets, meaning the “Source of Truth” is corrupted before it even enters the formal system.
VII. The Conclusion: The Cumulative Effect
The result of this “Multi-Flow, Single Cable” reality is a system of High Friction.
Data Reuse vs. Transformation: At every step, some data is reused (SKU), some is transformed (Technical Spec -> Marketing Bullet), and some is entirely new (Marketplace-specific keywords).
The Slowdown: Because 70% of the work is manual (Sheets + Transformations + Copy-Paste), the “Product Data Cable” acts as a funnel. Even if the ERP and PIM are “fast” systems, the human requirement to fill the 150+ attributes per product per category creates a bottleneck that prevents companies from competing in the age of AI Commerce.
In this environment, “AI Commerce” (Search Engines, LLM-based shopping assistants) is the ultimate consumer. If the 70% manual process yields even a 5% error rate, the AI will miscategorize the product, leading to zero visibility and lost revenue. The cable is only as strong as its most manual strand.
The Solution
I. The Painkiller: Solving PIM Ingestion
1. The Core Interface & Workflow
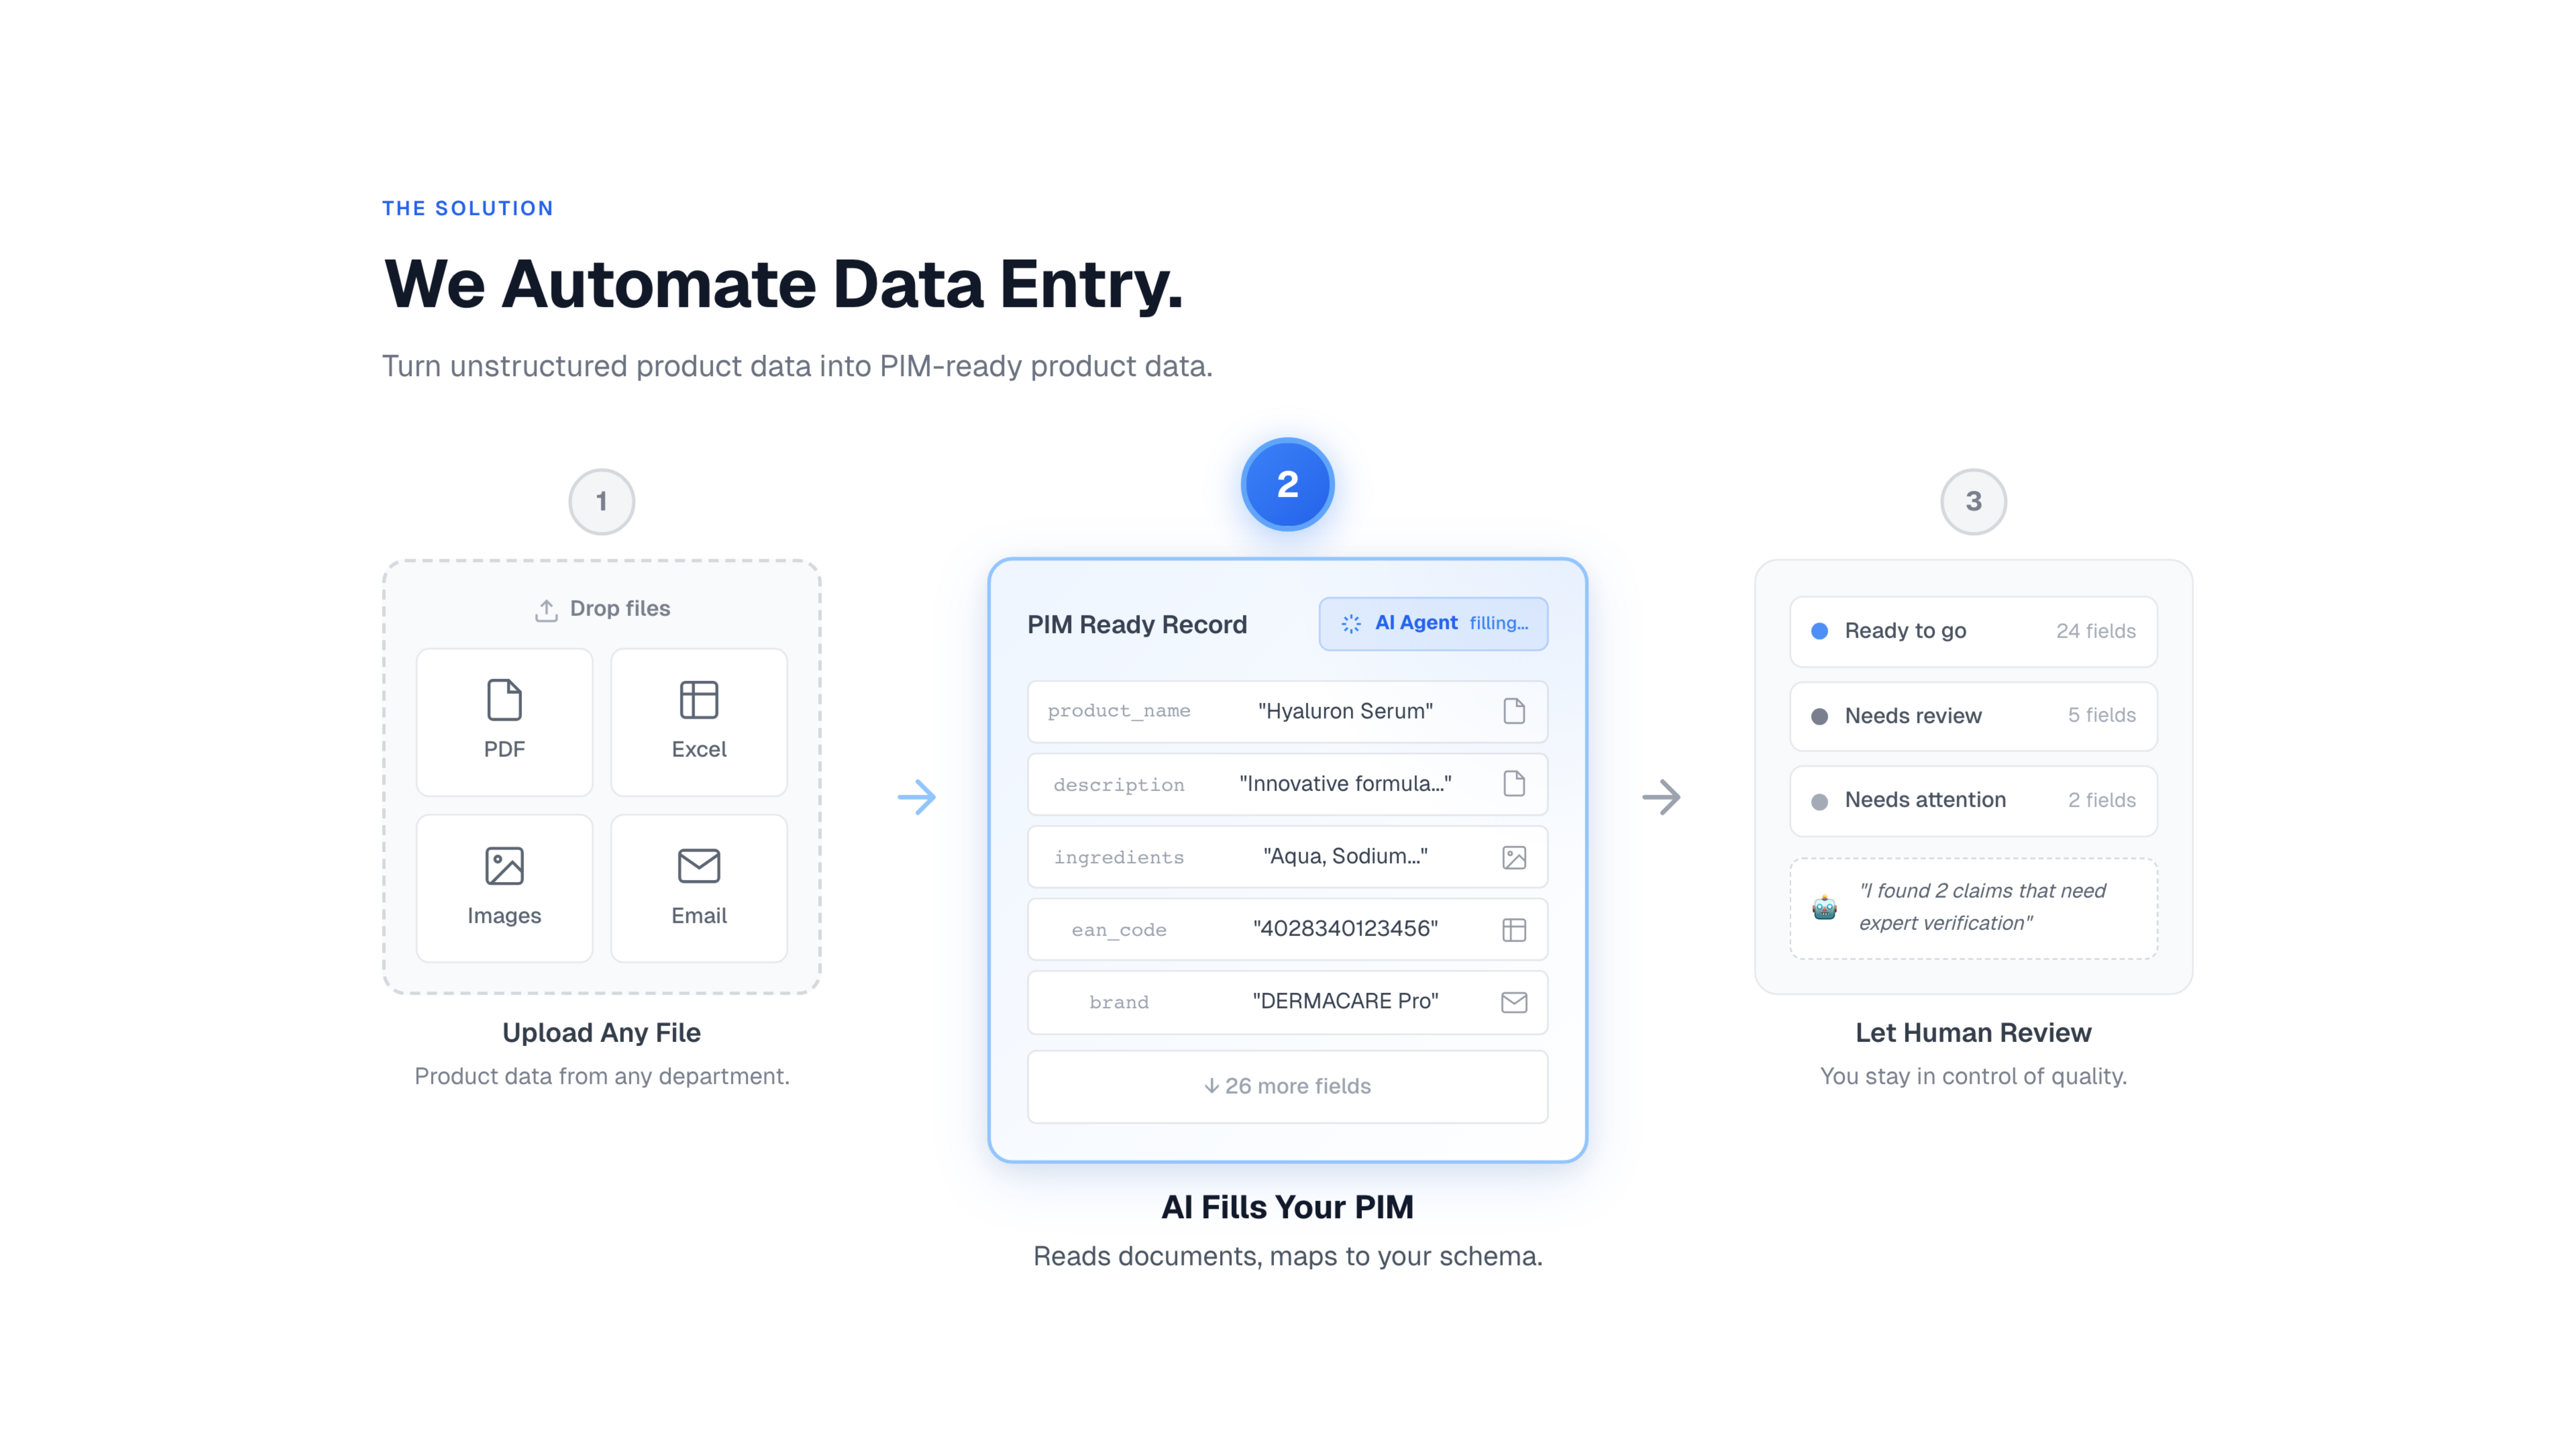
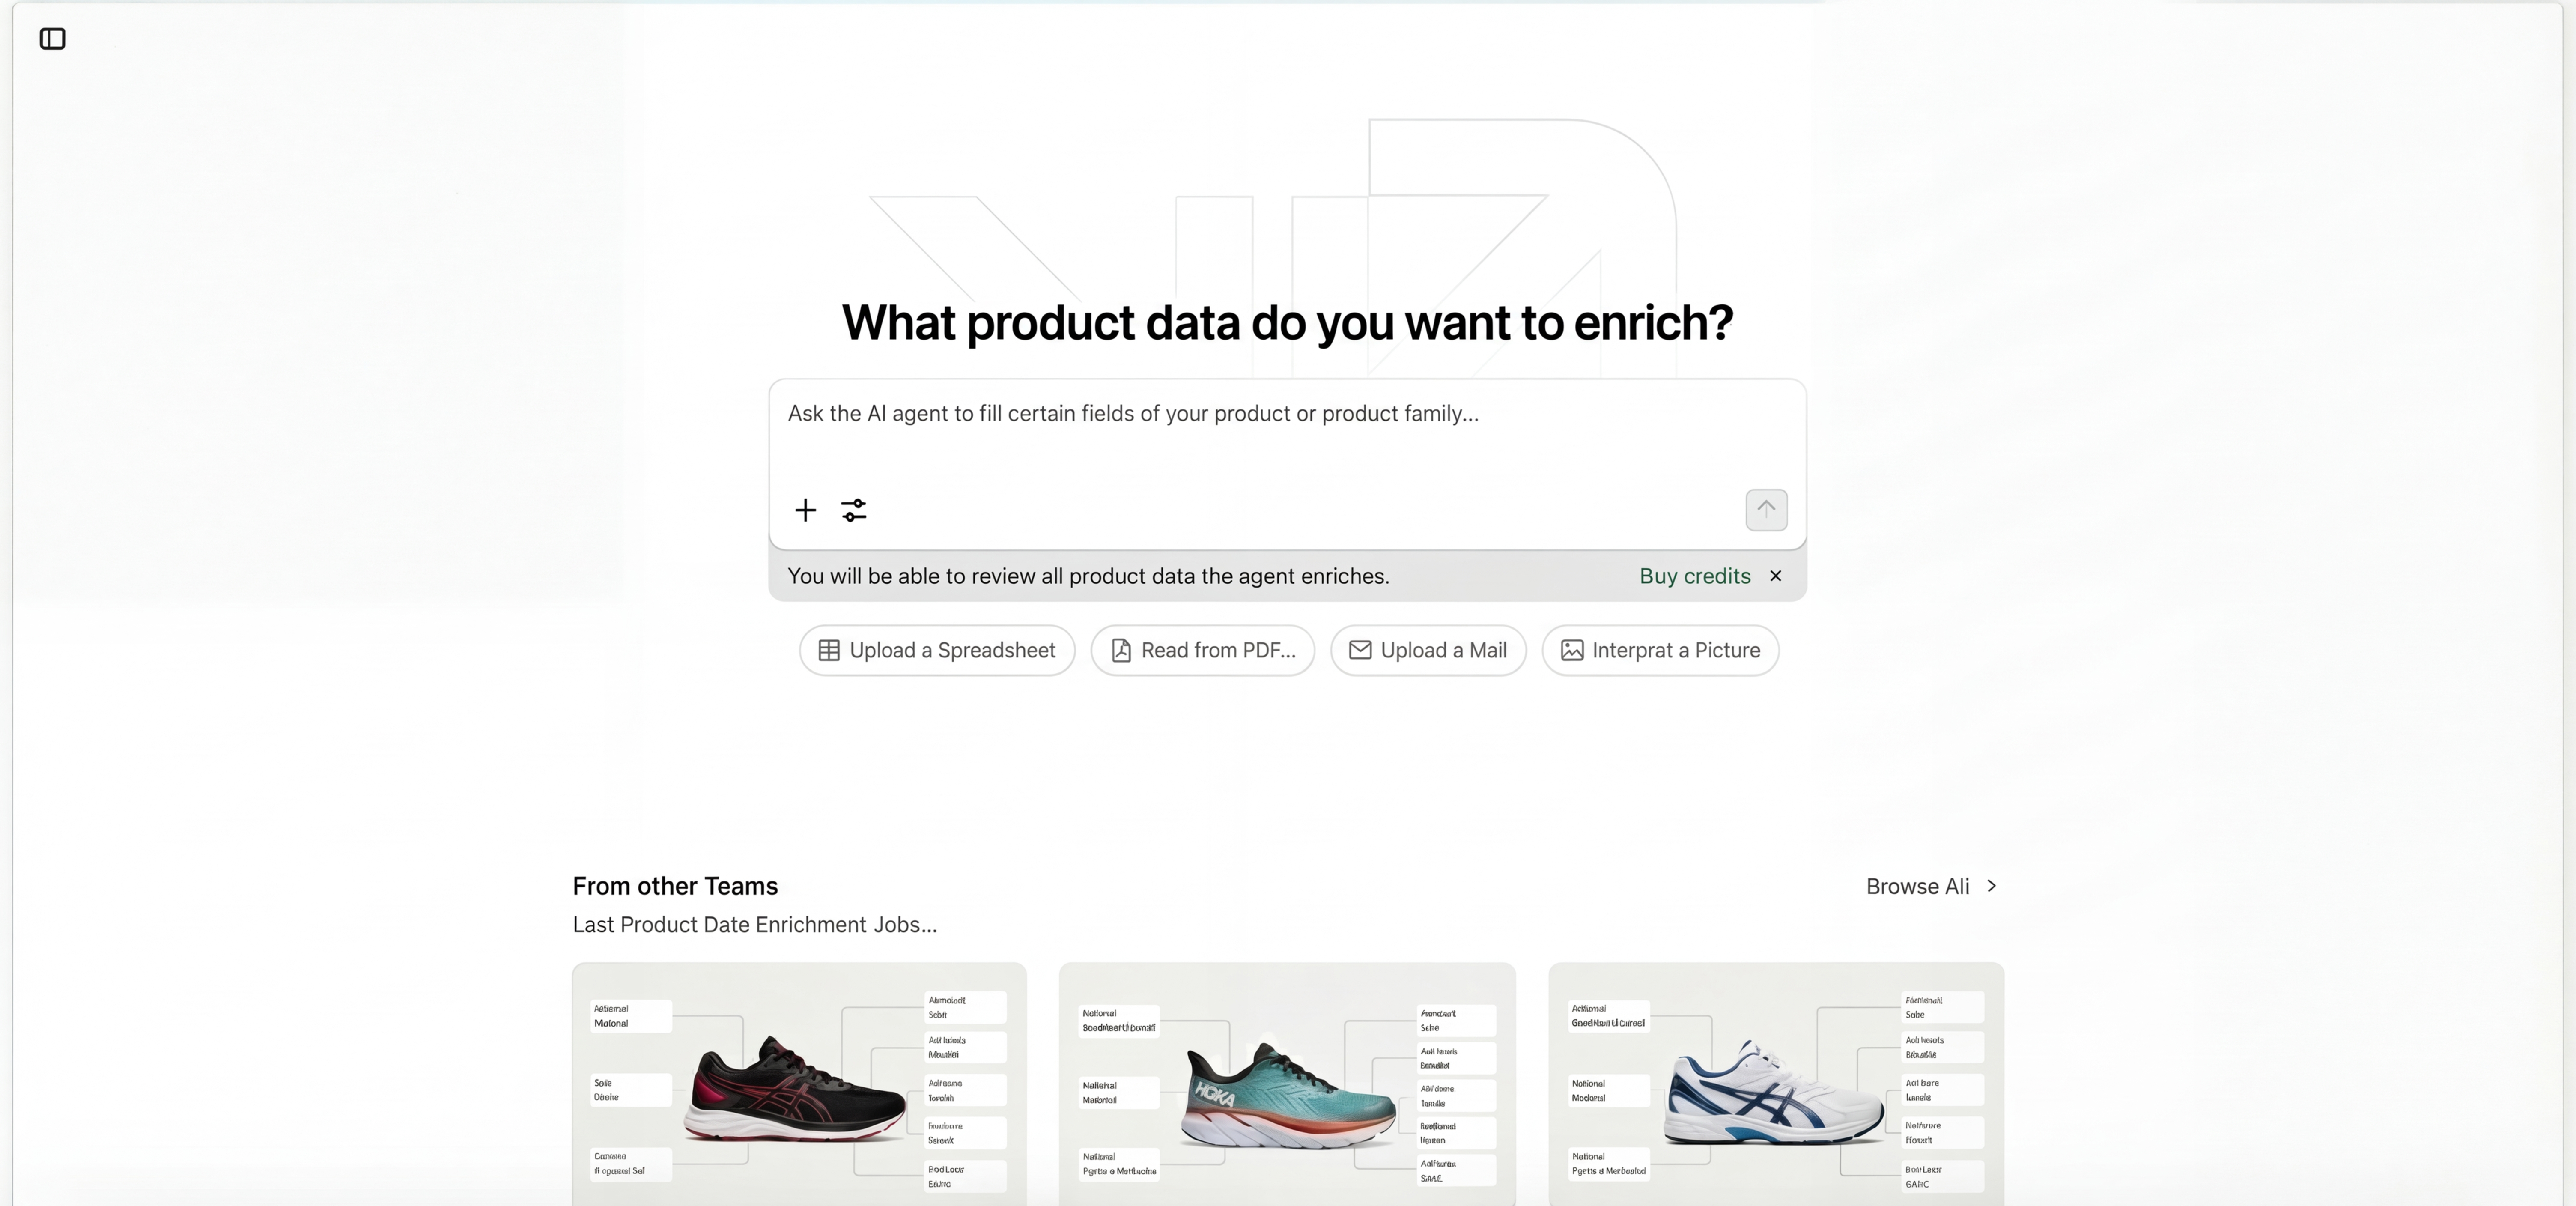
The Approach: We address a huge opportunity by using AI to interpret unstructured data through an interface designed to look like a chat agent or Lovable.dev.
The Experience: This creates a dedicated space where a user can simply drop information to be interpreted, normalized, and mapped against an underlying structure.
Target Systems:
General Targets: Spreadsheets or ERPs.
Primary Focus (Versions 1 & 2): PIM (Product Information Management) systems.
Value Proposition: The translation of unstructured data into structured data.
2. Technical Infrastructure
Operates on servers located in Europe or Germany to ensure sovereignty.
Utilizes a database and AI models like Azure OpenAI, Gemini, or self-hosted unstructured.io for document interpretation.
3. The “Bucket” Workflow
Sheet information enters a “bucket.”
The document is interpreted, and information is extracted as JSON.
This raw data is provided to an AI holding specific instructions about the company, the goal, and the mapping structure beneath the PIM.
4. The “Strict Directive” Optimization
Critical Optimization: The core logic defines how the AI reads and formulates extracted information.
The Directive: The system structures data and presents it for review, operating under a strict rule: It is instructed to fill out what it can, and explicitly instructed not to guess.
Goal: This is a complex optimization designed to minimize false positives, ensuring the AI knows what it is doing—something incredibly hard to achieve without deep experience.
Validation: We utilize validation via Zod.
Confidence Ranking: The system ranks the filling of structured fields based on confidence levels.
5. Solving Governance & The “Filter Form”
Review Process: The viewer is presented with a “filter form” on their unstructured data to accept, or they can route it to someone else for approval.
The “Governance” Problem: This solves the inherent issue in PIMs today.
Currently, a PIM functions like a government: everyone consumes the services and must contribute, but nobody feels responsible for it except the PIM team.
PIM teams are integration specialists rather than content experts.
Product managers and marketers do not view data entry as their job and actively avoid it.
The Solution: We make it easy for experts to review by eliminating copy-pasting and handling domain-specific transformations.
User Command: A user can simply write, “Use my unstructured data from this PDF and this Access sheet,” and the agent handles the zero-effort ingestion into the required product fields.
6. The Intermediate Draft State
Synchronization: Crucially, we maintain a layer that is always synchronized to the state below.
“Drafts” Storage: We store the AI’s suggestions in an intermediate AI layer (utilizing our database backend) as “Drafts.”
The Safety Buffer: We do not write to the PIM until the “Accept” button is hit. The UI displays the AI’s suggestions before they touch the record of truth.
Conflict Prevention: The system checks if the underlying system changed when writing to it, even while we wait for acceptance of our data filter, to prevent data conflicts.
II. The Vision: The AI Sales Engine
1. From Painkiller to Channel Management
The Shift: This moves us from the painkiller phase to the follow-up vision where we are delivering and writing back.
The Role: We become the AI agent that sells to AI search engines.
Data Flow:
We consume data from the PIM.
We send everything that was ingested via us to ChatGPT and Gemini.
Auto-Mapping: We already know how this graph will look and how the data has to look to be sent there. With minimal configuration, the agent should map this by itself.
Channel Management: We become a system integrating product data and potentially other information (like pricing often found in the PIM) and sending this data to ChatGPT and Gemini.
2. Optimization & “Ultrarelevant” Integration
Optimization Capability: We provide the ability to optimize this product data, targeting sales, SEO, and performance marketing professionals.
Data Pairing: We optimize the wording of fields because we pair it with data currently coming from “Ultrarelevant dot com.”
Ranking Improvement: We can see how to improve ranking by changing the wording, integrating data on the action prompt responses within the system to optimize for more sales.
SEO Logic: Search engines are crawled for the specific topic/product we are selling to identify certain prompts on how the product could be found in ChatGPT. The system improves the product data we send to ChatGPT based on this.
3. Marketing Campaigns & Monitoring
Campaigns: We can run offers, discounts, and marketing campaigns started with this channel management engine.
Execution: Giving discounts via ChatGPT and Gemini just like we do on Google right now, anticipating this economy will start to explode.
AI Monitor: The optimization part is mostly done via the AI agent acting as a monitor.
User Interaction: It simply asks:
“Do you want to change this wording from this field to improve the ranking of the products inside the AI search engine?”
“Do you want to make this discount to sell more?“
4. Closing the Loop: Transaction & Write-Back
Transaction Integration: When a customer buys in an AI chat engine, GPT handles the payment via the company’s Stripe integration.
Data Bridge: This information is sent to the channel management service (Ultrarelevant).
Write-Back: The AI sales agent brings this further, writing the order back to the company’s ERP with almost no configuration (we just have to attach the ERP).
Revenue Model: It takes a cut on sales like Tradebyte would do.
Current Status: While it is still unknown how this writing to the ERP will work in practice, the overall vision is clear.
Ultimate Identity: We are fixing the product data gap and becoming the AI sales engine for the company—basically a salesperson in the company that owns the AI commerce channel.
III. How We Build It: Roadmap & Methodology
1. The 5-Dimension Development Approach
Let’s think about how we approach the product building. We have a five-step approach on how we build out or increase the feature set of the product:
Dimension 1 (Accuracy):
Optimize the accuracy of the agent interpreting unstructured data or just reading it out and pasting it into a structured field/mapping (e.g., an Excel spreadsheet).
First step: Excel spreadsheet to Excel spreadsheet. Basically, copy and paste.
Dimension 2 (Transformation):
Introduce minor transformations.
Input: PDF or extra spreadsheet data is interpreted.
Process: The agent has certain instructions, transforms the data into the spreadsheet, and sends it out for review.
Focus: Domain-specific changes according to the solution (interesting for go-to-market).
Dimension 3 (Inputs & Prompting):
Start with existing spreadsheets and add more data points (PDF, then Image, and Text/Email).
Focus on pure interpretation with agent instructions.
Optimization: Refining additional instructions given inside the chat interview or prompt field.
Dimension 4 (PIM Integration - Version 4 Mechanics):
Move from a spreadsheet to a PIM system.
Focus: Integrating/consuming information from the PIM system on the current graph.
Mechanism: Connect via API (e.g., Akeneo or Pimcore API). The agent replaces the “bottom spreadsheet” from earlier versions with a direct view into the PIM’s schema. It treats the PIM schema as the “target sheet,” allowing it to map directly to the live system structure.
Dimension 5 (Graph Navigation - Version 5 Mechanics):
Focus: Moving away from opening one product to insert info or giving specific field instructions.
Mechanism: The agent gains autonomy. Instead of us selecting the product, the agent navigates the graph (traversing from Product Family -> Variant -> Specific Attribute) to find empty spots that match the unstructured data in the “Bucket.”
2. Execution & Methodology
POC Build: With the solution for data ingestion defined, we execute the build starting with a POC that interprets unstructured data to structured data.
POC Architecture: Functions via a “two sheets” architecture where one sheet on top feeds into the interpreter, which passes to the agent utilizing instructions to fill out a structured sheet below.
Expansion: In the second form, we expand to interpret more inputs like product data from PDFs.
Development Strategy:
This will be developed with AI coding agents step by step.
When we reach PMF (Product-Market Fit), we will rebuild this with a late-stage co-founder or CTO owning and maintaining the stack.
Timeline:
There should be an AI-generated version in one week.
A reliable production version in three to four weeks.
IV. Risks & Technical Feasibility
1. Domain Agnostic & Speed
Domain Agnostic Operation: We operate domain agnostic, meaning we always use the newest chat agent, the newest coding agent, and use the newest interpretation and model for the agent inside.
Model Flexibility: We use OpenAI’s, Azure OpenAI’s, Gemini’s model, and also Anthropic’s model.
Quality & Speed: With that, we ensure that we on Godlike speed always deliver the best quality.
2. Security & Compliance
PII Risk: We address the risk of security and compliance by explicitly not using personal identity information (PII) in here.
Data Processing: As we store drafts in between in our AI layer to have these approval pages, we ensure no sensitive data is processed in a way that violates regulations.
Sovereignty: We host in Europe/Germany to ensure sovereignty.
3. API Availability
Risk: Whether PIMs are able to give us this information.
Feasibility: The answer is yes. The market leaders, Pimcore and Akeneo, give us sufficient APIs for this, confirming that the integration is technically feasible.
4. AI Capabilities & Graph Navigation
Risks:
The risk of the AI not being able to navigate through the product graph.
The risk of the AI not being able to transform the information correctly.
Mitigation: This is why our development roadmap is structured in dimensions, starting with direct mapping instructions before moving to autonomous graph navigation, allowing us to validate the AI’s capability at each step of complexity.
Go-to-Market Strategy
Our Go-to-Market strategy is executed on three distinct levels of granularity: the strategic selection of the Market, the precise definition of the target Account, and the tactical engagement of the Lead.
I. Market Level: Strategic Selection & Mapping
We did not select our target markets randomly. We mapped and ranked 40 distinct industries across B2B and B2C segments to identify the specific intersection where the “Product Data Cable” is broken and the threat of AI Commerce is imminent.
1. The Ranking Dimensions
We scored these industries based on five specific criteria to calculate their attractiveness:
Pain Magnitude (The Trionomy): We assessed the intensity of Attribute Density (number of fields), Transformation Complexity (difficulty of writing), and Launch Velocity (frequency of updates).
Implementation Friction (Regulation): We target the “Sweet Spot”—complex enough to be painful, but not highly regulated (like Pharma) where sales cycles freeze.
Deal Size: B2B for high ACV (Average Contract Value) and stickiness; B2C for speed and feedback loops.
AI Commerce Relevance: The likelihood that consumers will use AI Agents (LLMs) to buy these products.
2. The Target Industries
We prioritized five industries based on the specific “Job to be Done” for the AI Agent:
Cosmetics (B2C): Driver: Personalization. High density (Ingredients) + High velocity (Seasonal Collections).
Consumer Electronics (B2C): Driver: Technical Comparison. High specs + High complexity.
Sports Goods (B2C): Driver: Lifestyle Fit & Comparison.
Manufacturing/Bearings (B2B): Driver: Education. The gap between user knowledge and product complexity is high. Buyers use AI to find technical fits in massive catalogs. High Deal Size.
Furniture (B2C/B2B): Driver: Visualization & Comparison. High return rates due to bad data make this a high-pain vertical.
3. The Product Entry Wedge
To lower the barrier to entry, we structure our offering by risk:
The Entry (Low Risk): We automate the 15% “Last Mile” work (Copy-Paste from PDF/Email). No domain knowledge required. This builds trust.
The Expansion (High Risk): We move to the 15% “Expert Bottleneck” (Transformations). We manage this by ranking risk: Context Gap (Tech to Marketing), Language Gap, and Liability Gap (Legal Claims).
| Industry | Segment | Pain | Speed | Deal Size | AI Commerce | GTM Score |
|---|---|---|---|---|---|---|
| Cosmetics | B2C | 89 | 95 | 60 | 65 | 81.7 |
| Consumer Electronics | Hybrid | 89 | 78 | 78 | 82.5 | 80.7 |
| Supplements | B2C | 83 | 92 | 58 | 61.5 | 78.2 |
| Mattresses | B2C | 78 | 82 | 55 | 78 | 75.0 |
| Beauty Devices | B2C | 85 | 80 | 60 | 75 | 74.0 |
| Baby Products | B2C | 82 | 88 | 55 | 75 | 77.0 |
| Drones | Hybrid | 80 | 70 | 60 | 80 | 71.5 |
| Wearable Health Tech | B2C | 75 | 78 | 50 | 75 | 70.1 |
| Power Stations (EcoFlow) | Hybrid | 78 | 70 | 65 | 75 | 69.8 |
| Photography Gear | Hybrid | 82 | 75 | 50 | 80 | 72.2 |
| Fashion | B2C | 70 | 85 | 45 | 60 | 69.0 |
| High-Value Sports Gear | Hybrid | 75 | 70 | 55 | 67.5 | 68.1 |
| Pet Medical / Supplements | B2C | 80 | 78 | 45 | 78 | 68.2 |
| High-End Bikes | Hybrid | 78 | 65 | 65 | 75 | 68.2 |
| E-Bikes | Hybrid | 80 | 65 | 70 | 80 | 70.5 |
| Bearings | B2B | 92 | 40 | 70 | 85 | 68.5 |
| Pumps & Filtration | B2B | 95 | 35 | 80 | 85 | 67.8 |
| Scientific Consumables | B2B | 86 | 50 | 55 | 85 | 67.7 |
| Fasteners | B2B | 90 | 45 | 60 | 80 | 67.5 |
| Industrial Equipment | B2B | 89 | 38 | 82 | 70 | 60.5 |
| Construction Components | B2B | 88 | 40 | 70 | 80 | 66.1 |
| Luxury Goods | B2C | 65 | 85 | 60 | 70 | 66.0 |
| Home Appliances | Hybrid | 78 | 65 | 55 | 75 | 66.5 |
| Smart Home / Lighting | B2C | 70 | 78 | 48 | 72 | 66.3 |
| Motorcycle Gear | Hybrid | 76 | 60 | 60 | 70 | 64.3 |
| Chemical Products / Cleaners | B2B | 80 | 60 | 45 | 75 | 63.8 |
| Musical Instruments | Hybrid | 72 | 70 | 40 | 80 | 63.4 |
| Pet Products | B2C | 65 | 85 | 40 | 70 | 63.8 |
| Camping / Overlanding Gear | Hybrid | 70 | 65 | 50 | 68 | 63.1 |
| Ergonomic Furniture | B2C | 72 | 70 | 50 | 70 | 64.4 |
| Electrical Installation | B2B | 88 | 40 | 65 | 82 | 65.1 |
| Fire Safety Systems | B2B | 90 | 35 | 75 | 85 | 65.5 |
| Industrial Adhesives | B2B | 85 | 40 | 55 | 80 | 62.3 |
| DIY / Tools | Hybrid | 70 | 60 | 45 | 65 | 58.0 |
| B2B Manufacturing | B2B | 94 | 25 | 95 | 67.5 | 58.6 |
II. Account Level: The Ideal Customer Profile
Once the market is selected, we drill down into the specific organizations. We focus on the “Mid-Market Growth” segment.
1. Firmographics
Revenue Criteria: €30M – €1B.
Why: Companies under €30M lack the data volume to feel the pain; companies over €1B suffer from bureaucratic inertia that slows early adoption.
Growth Signals: We target companies currently scaling in Revenue, Headcount, or have received recent Funding.
Tech Stack: Companies that already have a PIM (Product Information Management) system but are still hiring data entry clerks—a clear sign of process failure.
2. Psychographics
The Mindset: These companies are terrified of losing market share to agile competitors on marketplaces (Amazon/Zalando).
The Pain: They are experiencing “Launch Drag”—new products take weeks to get online due to manual data entry.
Target Examples: We are validating with Cosnova (High Velocity B2C), IGUS (Complex B2B), and Franz Mensch (Regulated Hygienic Goods).
Stand 21. Dezember 2025: Insgesamt sind es 605 Unternehmen in DACH
3. Verteilung nach Industrie
| Industrie | Anzahl |
|---|---|
| Machinery (Maschinenbau) | 98 |
| Electronics (Elektronik) | 94 |
| Plastics (Kunststoffe) | 83 |
| Furniture (Möbel) | 65 |
| Food (Lebensmittel) | 56 |
| Sports (Sport) | 42 |
| Cosmetics (Kosmetik) | 39 |
| Medical (Medizin) | 23 |
| Other (Sonstiges) | 22 |
| Fashion (Mode) | 22 |
| Consumer Electronics (Unterhaltungselektronik) | 19 |
| Office (Büro) | 14 |
| Deco (Deko & Wohnaccessoires) | 13 |
| Petcare (Tierbedarf) | 9 |
| Automotive (Automobil) | 4 |
| Manufacturing (Fertigung) | 2 |
| GESAMT | 605 |
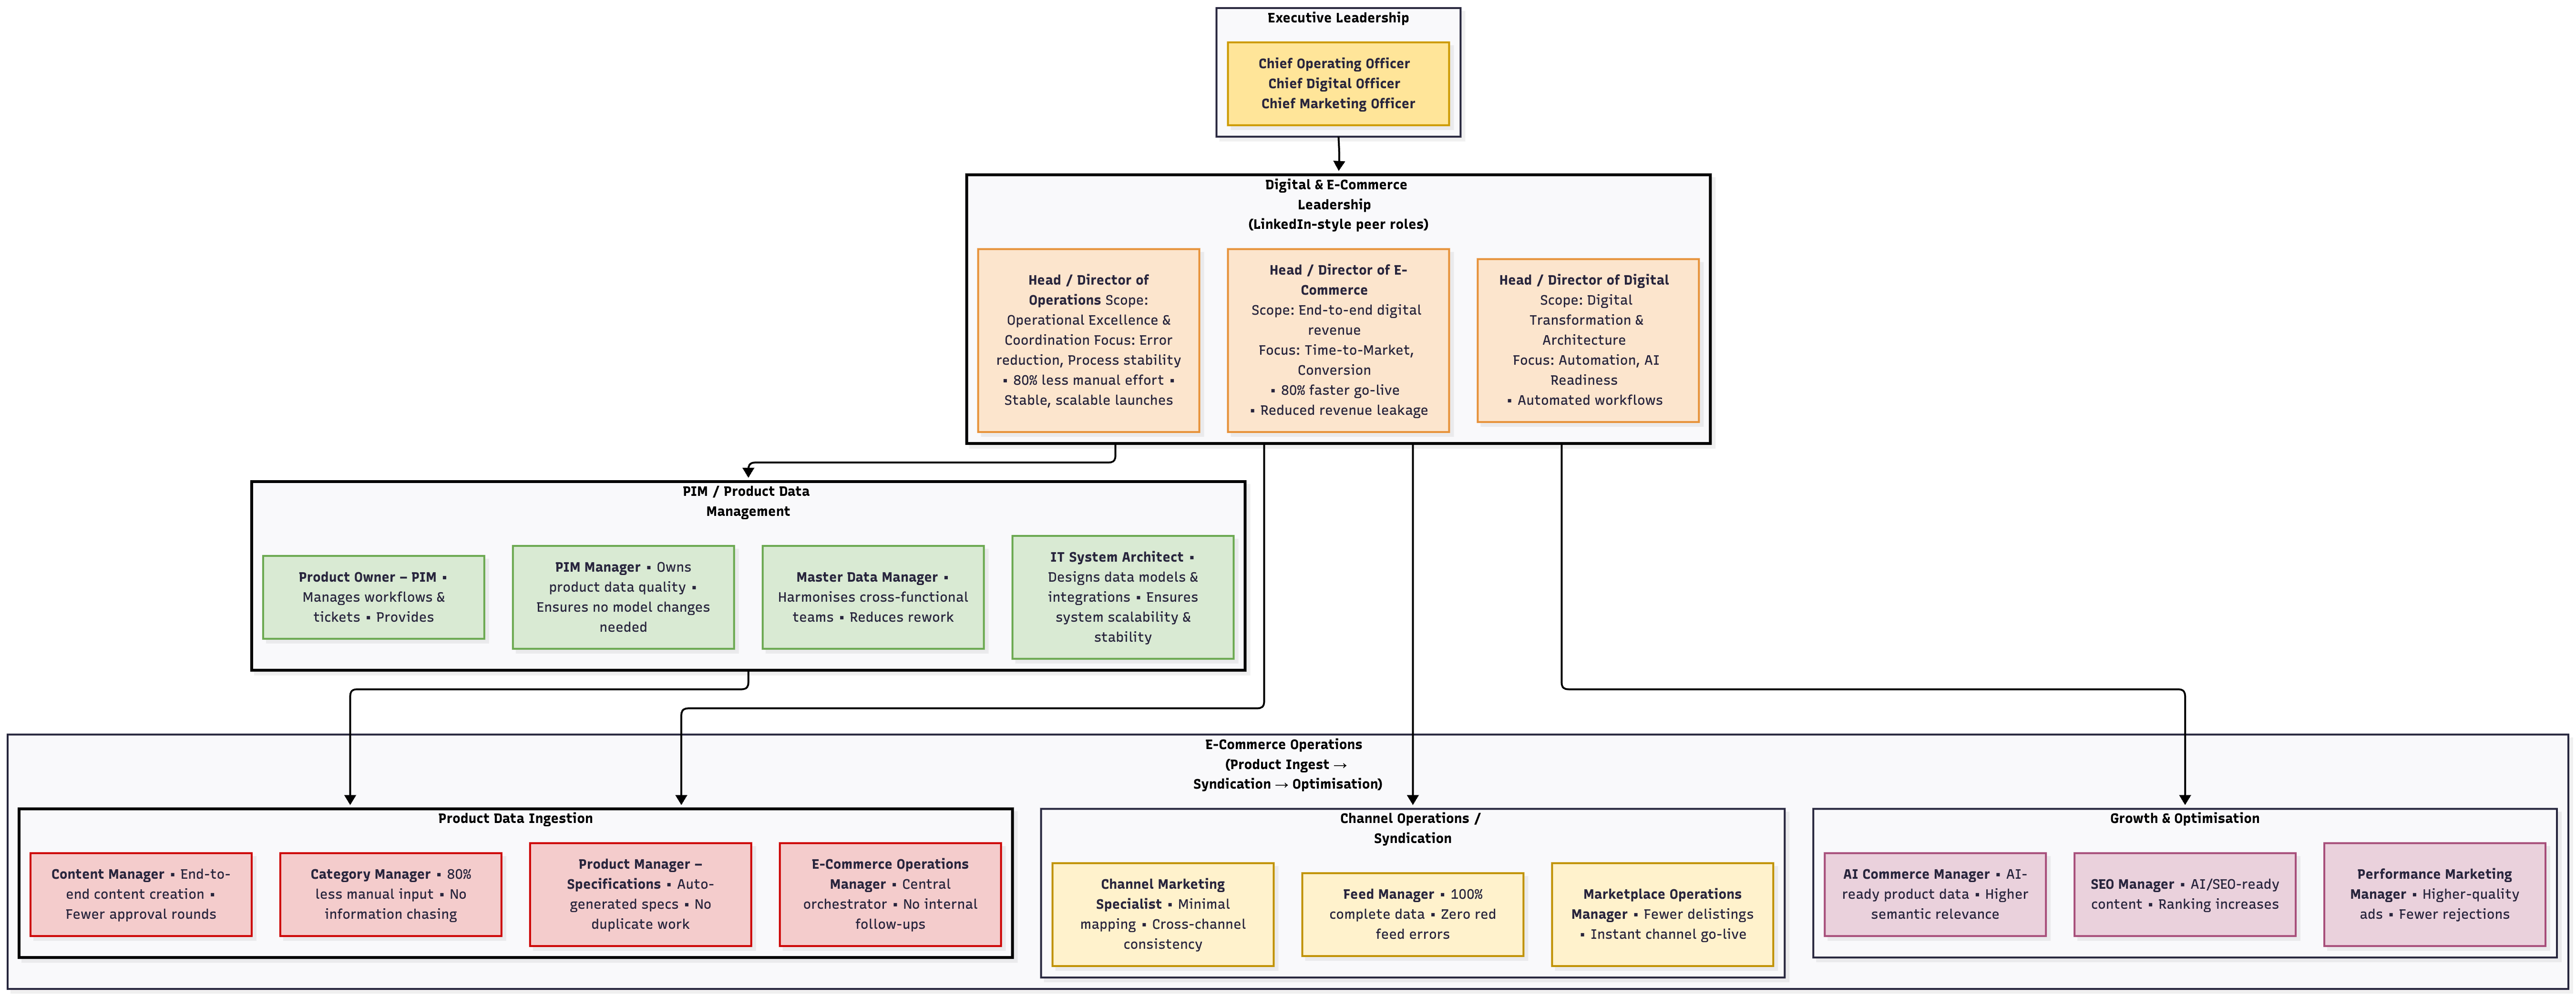
III. Lead Level: Personas & Outreach
This is the execution layer: who we talk to, the strategy (Warm to Cold), and the channels (LinkedIn/Email/Phone) we use. Currently we searched up 400+ Leads from targeted Accounts.
1. The Internal Personas
We distinguish between three internal roles with specific job titles. Crucially, our target shifts based on our stage.
A. The User (The Pain Holder):
Titles: Strategic Marketing Manager, Product Manager, Strategic Product Manager, Category Manager, Catalog Manager.
Role: They do the manual work.
Discovery Phase Strategy: We focus here 90% of the time. We validate the pain. We do not sell ROI; we sell “Relief from Excel.”
B. The Buyer (The Budget Holder):
Titles: Head of E-commerce, Head of Digital, Head of Category Management, Head of Product Management.
C-Level: Chief Operating Officer (COO), Chief Digital Officer (CDO).
Role: They own the P&L.
Sales Phase Strategy: Once we have proof, we pivot here. We sell Business Impact: Speed-to-Market, Revenue Protection, and AI Readiness.
C. The Supporter (The Gatekeeper):
Titles: IT Solutions Architect, PIM Manager, Master Data Manager.
Role: They own the infrastructure.
Strategy: Assurance. We must prove we are an additive layer, not a replacement.
2. The Outreach Strategy
We classify our approach by “Relationship Temperature.”
Warm Outreach (High Trust):
Sources: WHU Alumni (mapping alumni at target firms), Parental/Personal Networks, and Strategic Angels/Mentors (approaching C-Levels for advice, which converts to pilots).
Leverage: Consultants who are already working inside the account.
The Bridge (Industry Experts):
Sources: Ex-COOs, Retired Veterans, Ex-Consultants.
Tactic: We treat them as “Oracles.” We ask for their expert opinion. They validate our thesis and open doors to their former colleagues.
Cold Outreach (Scalable Direct):
Sources: Creating our own lead lists via data providers. This is our engine for finding the scalable growth channel.
3. The Channels
How we physically deliver the message across the temperatures above.
Channel A: LinkedIn
Function: This is our primary testing lab for messaging. We view it as a funnel: First Contact → Response → Discovery Call.
The “Yes” Arguments: We test different hooks to see what works:
Sympathy: “We are young, eager founders.”
Ego: “You are the expert; we need your opinion.”
Incentive: “We offer Advisor shares or payment for your time.”
The “No” Blockers: Sales fatigue, Problem Denial, or simply busy timing (Q4).
Channel B: Email
Function: High-volume, targeted scalability.
Channel C: Phone
Function: High friction, but immediate feedback.
Channel D: Video Call
Function: This is the goal of all previous channels.
Tactics: In the Discovery Phase, this is an interview, not a demo. We ask questions to map their specific “Data Cable.” In the Sales Phase, this becomes the demo environment.
IV. Strategy & Funnel Dynamics
Our strategy is distinct across two phases. We currently optimize for Truth, not Revenue.
1. The Strategic Pivot
We distinguish sharply between validated learning (Phase A) and market capture (Phase B).
Phase A: Discovery (Current)
Goal: Validated Learning (Proving User Pain).
Target: The User (Product Managers) & Industry Experts.
KPI: Outreach → Discovery Call Ratio.
Phase B: Sales Scale (Future)
Goal: Revenue & Market Share.
Target: The Buyer (Heads of / C-Level).
KPI: CAC, ACV, and Closed Won deals.
2. The Funnel Logic
Outreach is a scientific process focused on optimizing three conversions:
First Contact: Connection Request / Cold Email.
The Response: Eliciting a human reply (Positive/Negative).
The Call: Converting the reply into a 30-min video interview.
3. Psychological Drivers
Since we lack brand recognition, we leverage four specific human triggers to get a reply:
Startup Sympathy: Playing the “young, eager founder” card to leverage goodwill (e.g., WHU network).
Ego Appeal: Positioning the prospect as an “Industry Veteran” whose expert opinion is vital.
Incentive: Offering payment for consultation to signal seriousness.
Authenticity: Using raw, non-salesy tonality to differentiate from automated bots.
4. The Resistance
When the funnel breaks, we identify and fix one of four blockers:
Sales Fatigue: They fear a pitch.
Problem Denial: They accept the status quo.
Cognitive Load: Message is too complex.
Operational Timing: B2C targets drown in Q4.
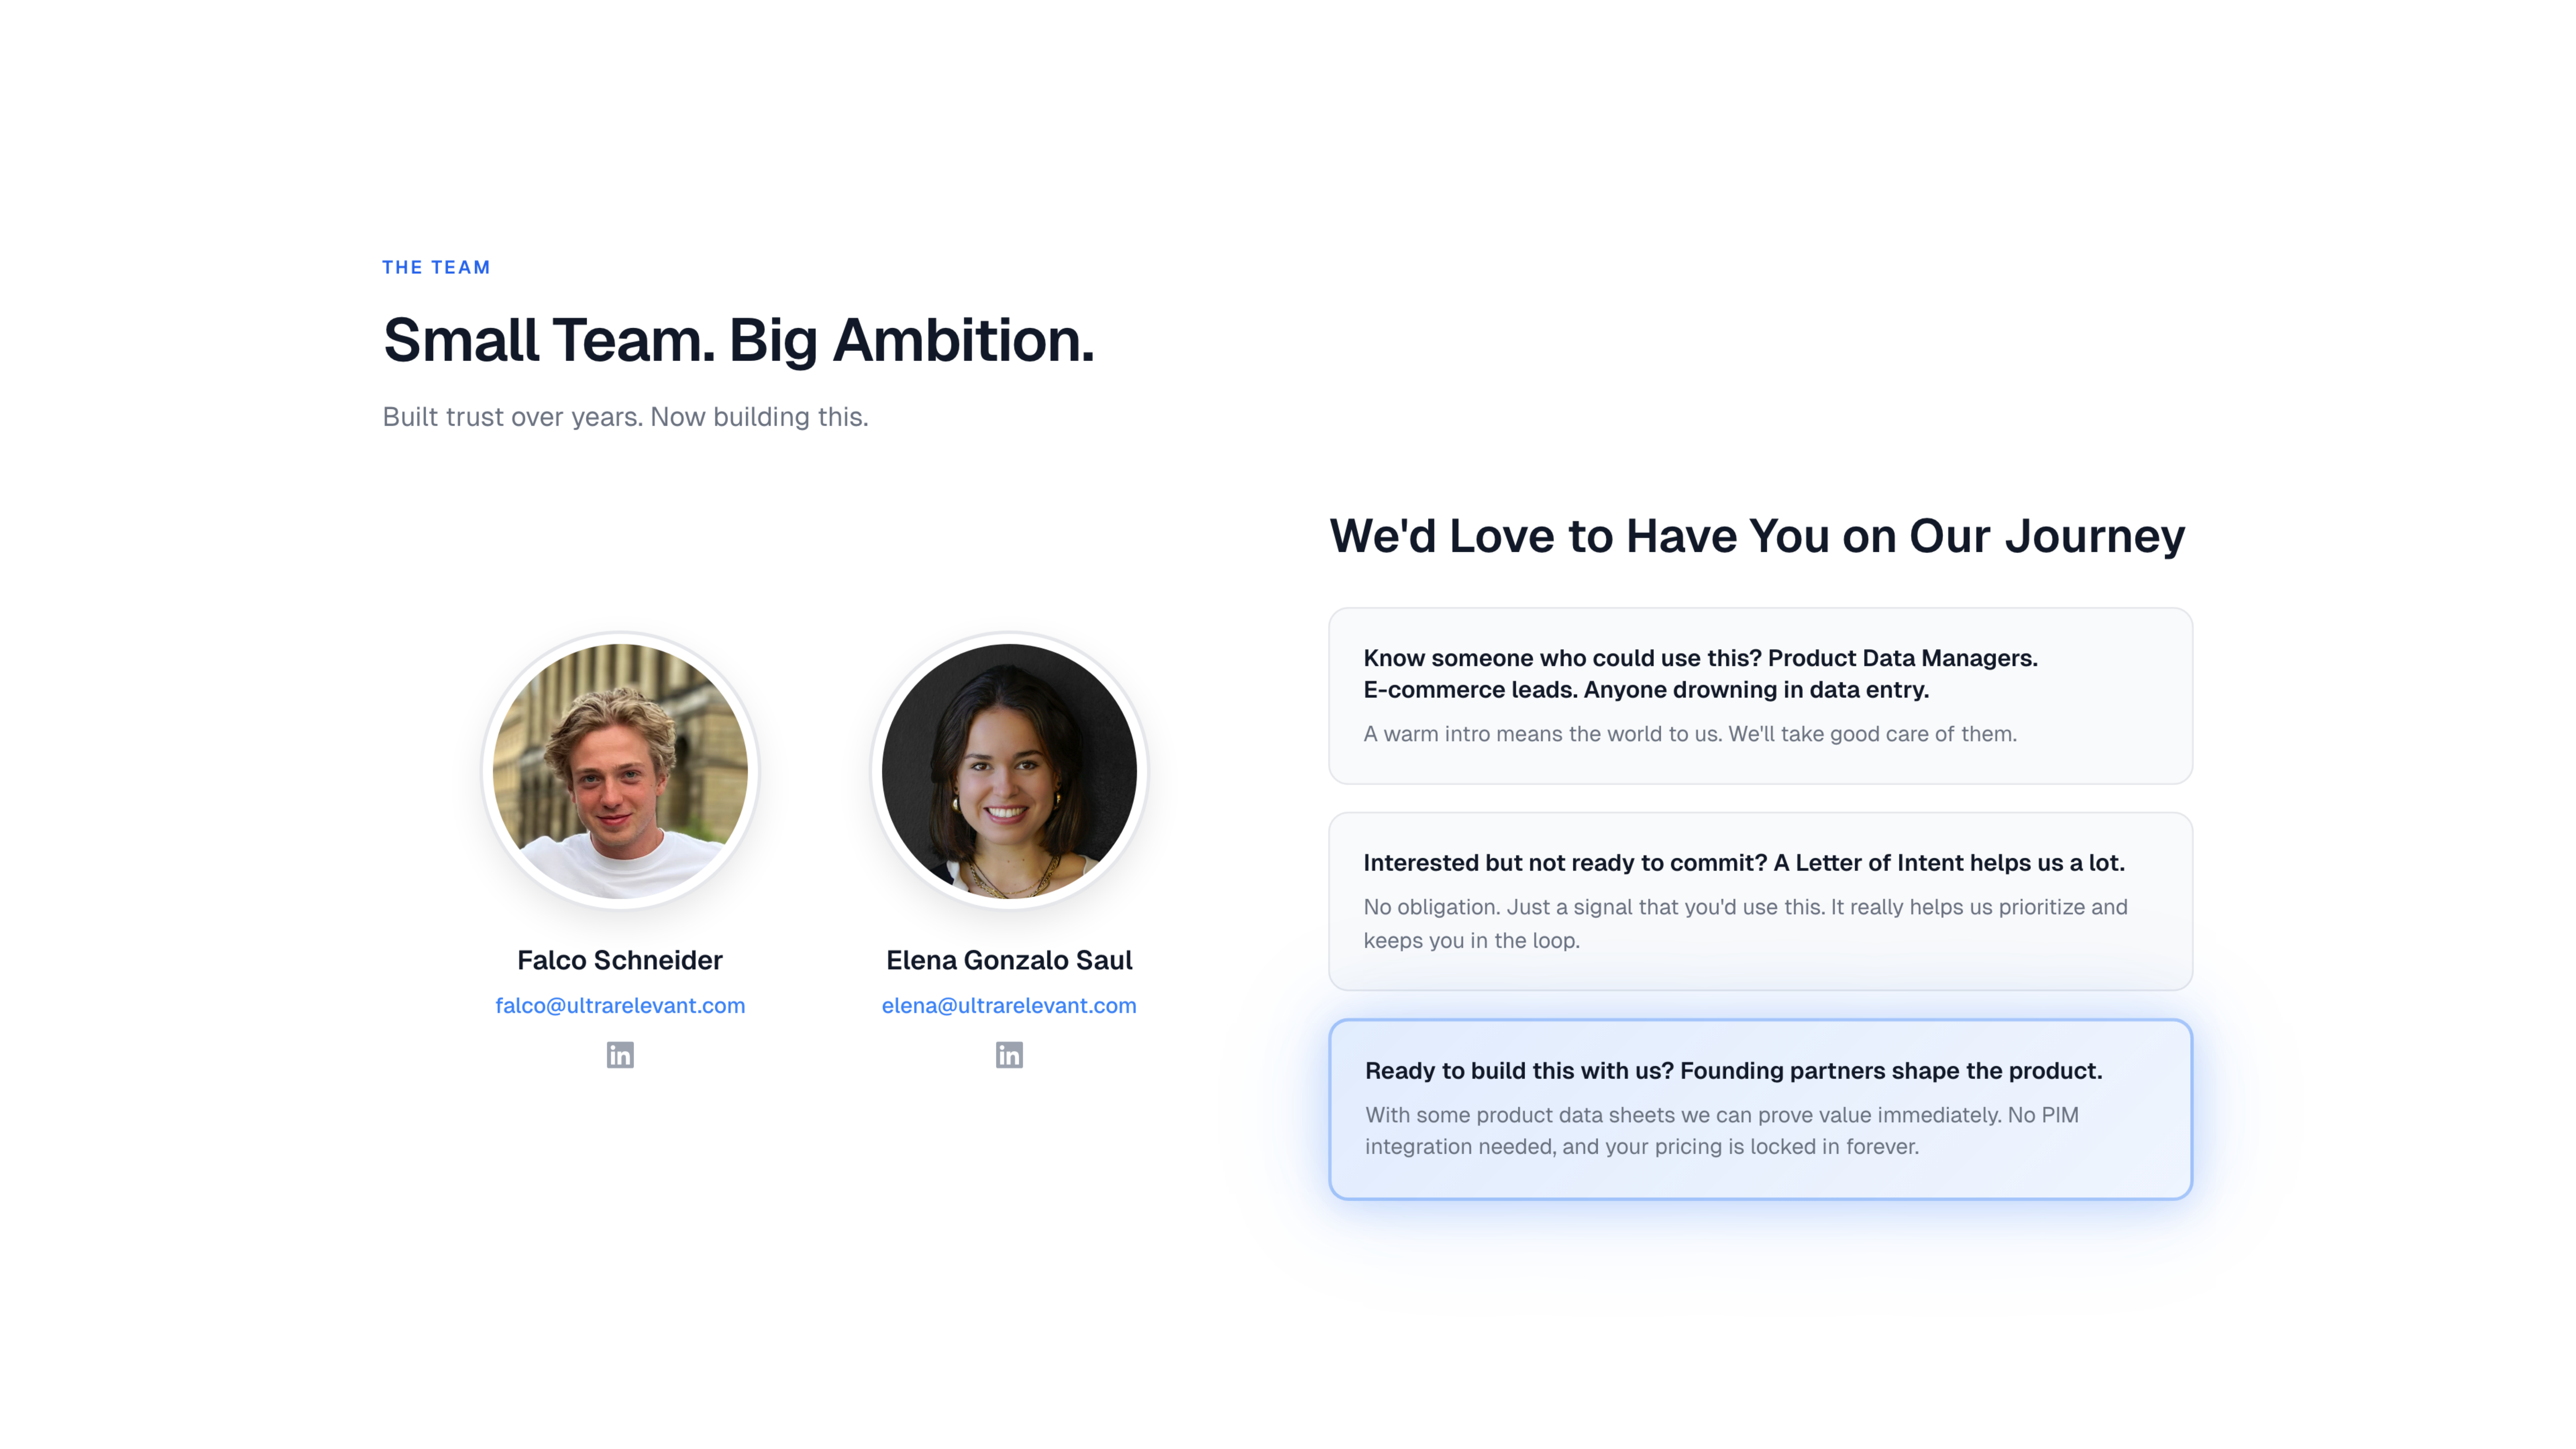
The Team